the two blades are of same polarity, so the torques aresummed up.Figure 4. CFX model of the Savonius-type wind turbine.V. ANALYSIS RESULTS AND DISCUSSIONA. Static AnalysisThe turbine performances under fixed rotor conditionsare explored. The torque generated for fixed wind velocityis analyzed. As the torque depends on the rotor angularposition, the analysis is repeated for successive positions.Analysis from 0 to 180 degree (half turn) is sufficient dueto the symmetry of the rotor. The analyses are timeconsuming: with the available computer the analysis timefor one position was about ten hours. The results are givenby diagram in Fig. 5. The wind velocity profile for thehorizontal cross section, near the maximum torque case, isgiven in Fig. 6.Figure 6. The wind velocity profile in the horizontal cross section forthe maximal torque case.Calculation of the static torque for zero angle positionhave shown that shortening straight ends of the bladesincrease the torque in this position. Further analyses arenecessary to find the average value of the torque for acomplete revolution and justify that the original geometryis not optimal.B. Dynamic AnalysisThe dynamic analysis of the turbine requires a differentCFD modeling approach which needs further researchwork. Based on experiments, for wind speed 10 m/s, theoptimal angular velocity of the turbine was about 5 rad/s.The dynamic torque is not evaluated until now, butsupposing that it is not much smaller than the averagestatic torque, values from 20 Nm to 30 Nm can besupposed. Multiplying the angular velocity with theaverage torque, the estimated turbine power is from 100W to 150W. This gives power coefficients far below thevalue reported in the patent document and below theachievable values for vertical axis wind turbines. Theauthors suppose that it is possible to optimize thegeometry which will be done in further work.ACKNOWLEDGMENTThe authors wish to express their thanks for Mr. AttilaRétfalvi from Subotica Tech for his help preparing thetechnical drawings necessary for CFD analysis.Figure 5. Static torque dependence on rotor angular position and windvelocity.Figure 5. shows separately the torques acting on theupstream blade (the blade closer to the wind inlet surface)and the downstream blade (closer to the wind outletsurface) and the resulting torque. For a traditionalSavonius turbine the torque acting on the blade with itsconcave side turned to the inlet surface is the opposite ofthe blade with its convex side turned to the inlet surface.This way the resulting torque is the difference of the twotorques. The geometry described in the patent documenthas the advantage that for almost all angles the torques onREFERENCES[1] S. Carcangiu, A. Fanni and A. Montisci, “Computational FluidDynamics Simulations of an Innovative System of Wind PowerGeneration,” Proceedings of the 2011 COMSOL Conference inStuttgart.[2] A. H. Benesh, “Wind Turbine with Savonius-type Rotor”, USPatent Number 5,494,407, Feb. 27, 1996.[3] S. J. Savonius, “Rotor”, Österreichisches Patentschrift Nr. 103819,July 10, 1925.[4] L. Tóth, G. Horváth, “Alternatív energia, Szélmotorok,szélgenerátorok”, Szaktudás Kiadó Ház, Budapest, 2003.48
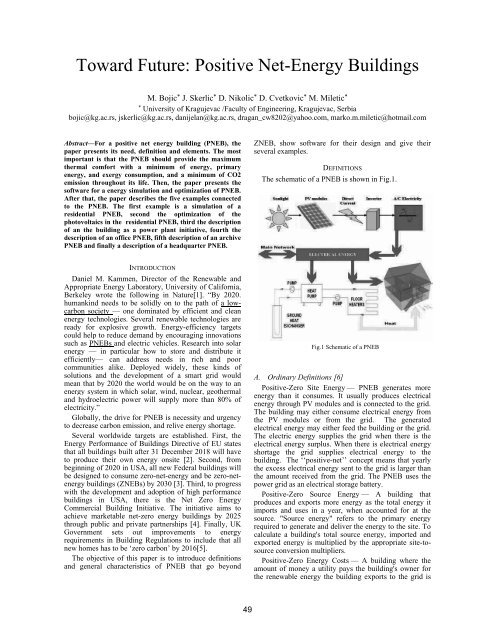
Toward Future: Positive Net-Energy BuildingsM. Bojic * J. Skerlic * D. Nikolic * D. Cvetkovic * M. Miletic **University of Kragujevac /Faculty of Engineering, Kragujevac, Serbiabojic@kg.ac.rs, jskerlic@kg.ac.rs, danijelan@kg.ac.rs, dragan_cw8202@yahoo.com, marko.m.miletic@hotmail.comAbstract—For a positive net energy building (PNEB), thepaper presents its need, definition and elements. The mostimportant is that the PNEB should provide the maximumthermal comfort with a minimum of energy, primaryenergy, and exergy consumption, and a minimum of CO2emission throughout its life. Then, the paper presents thesoftware for a energy simulation and optimization of PNEB.After that, the paper describes the five examples connectedto the PNEB. The first example is a simulation of aresidential PNEB, second the optimization of thephotovoltaics in the residential PNEB, third the descriptionof an the building as a power plant initiative, fourth thedescription of an office PNEB, fifth description of an archivePNEB and finally a description of a headquarter PNEB.ZNEB, show software for their design and give theirseveral examples.DEFINITIONSThe schematic of a PNEB is shown in Fig.1.INTRODUCTIONDaniel M. Kammen, Director of the Renewable andAppropriate Energy Laboratory, University of California,Berkeley wrote the following in Nature[1]. “By 2020.humankind needs to be solidly on to the path of a lowcarbonsociety — one dominated by efficient and cleanenergy technologies. Several renewable technologies areready for explosive growth. Energy-efficiency targetscould help to reduce demand by encouraging innovationssuch as PNEBs and electric vehicles. Research into solarenergy — in particular how to store and distribute itefficiently— can address needs in rich and poorcommunities alike. Deployed widely, these kinds ofsolutions and the development of a smart grid wouldmean that by 2020 the world would be on the way to anenergy system in which solar, wind, nuclear, geothermaland hydroelectric power will supply more than 80% ofelectricity.”Globally, the drive for PNEB is necessity and urgencyto decrease carbon emission, and relive energy shortage.Several worldwide targets are established. First, theEnergy Performance of Buildings Directive of EU statesthat all buildings built after 31 December 2018 will haveto produce their own energy onsite [2]. Second, frombeginning of 2020 in USA, all new Federal buildings willbe designed to consume zero-net-energy and be zero-netenergybuildings (ZNEBs) by 2030 [3]. Third, to progresswith the development and adoption of high performancebuildings in USA, there is the Net Zero EnergyCommercial Building Initiative. The initiative aims toachieve marketable net-zero energy buildings by 2025through public and private partnerships [4]. <strong>Final</strong>ly, UKGovernment sets out improvements to energyrequirements in Building Regulations to include that allnew homes has to be ‘zero carbon’ by 2016[5].The objective of this paper is to introduce definitionsand general characteristics of PNEB that go beyondFig.1 Schematic of a PNEBA. Ordinary Definitions [6]Positive-Zero Site Energy — PNEB generates moreenergy than it consumes. It usually produces electricalenergy through PV modules and is connected to the grid.The building may either consume electrical energy fromthe PV modules or from the grid. The generatedelectrical energy may either feed the building or the grid.The electric energy supplies the grid when there is theelectrical energy surplus. When there is electrical energyshortage the grid supplies electrical energy to thebuilding. The ‘‘positive-net’’ concept means that yearlythe excess electrical energy sent to the grid is larger thanthe amount received from the grid. The PNEB uses thepower grid as an electrical storage battery.Positive-Zero Source Energy — A building thatproduces and exports more energy as the total energy itimports and uses in a year, when accounted for at thesource. "Source energy" refers to the primary energyrequired to generate and deliver the energy to the site. Tocalculate a building's total source energy, imported andexported energy is multiplied by the appropriate site-tosourceconversion multipliers.Positive-Zero Energy Costs — A building where theamount of money a utility pays the building's owner forthe renewable energy the building exports to the grid is49
- Page 1 and 2: 4 4 th IEEE International Symposium
- Page 3 and 4: EXPRES 20124 th International Sympo
- Page 5 and 6: Application of Thermopile Technolog
- Page 7 and 8: Design of a Solar Hybrid System....
- Page 9 and 10: ___________________________________
- Page 11 and 12: environmental protection and global
- Page 13 and 14: But can we use the human body sweat
- Page 15 and 16: IX. REFERENCES[1] Todorovic B. Cvje
- Page 17 and 18: QQ⎛ Λt⎞=⎜⎟⎝ Λ ⎠Nt Nwh
- Page 19 and 20: Analysis of the Energy-Optimum of H
- Page 21 and 22: V. OBJECTIVE FUNCTIONThe objective
- Page 23 and 24: The Set-Up Geometry of Sun Collecto
- Page 25 and 26: continuous east-west sun collector
- Page 27 and 28: continuously measure the thermal ch
- Page 29 and 30: CEvaluation of measurement resultsA
- Page 31 and 32: Application of Thermopile Technolog
- Page 33 and 34: Temperature of the components [C]90
- Page 35 and 36: nighttime, to weather or to the cha
- Page 37 and 38: η uη u0.50.40.30.20.1T 1 - 400K0.
- Page 39 and 40: Figure 10. . SPS Concept illustrati
- Page 41 and 42: [16] Zoya B. Popović: Wireless Pow
- Page 43 and 44: 25.0020.0015.0010.005.000.00Figure
- Page 45 and 46: · ℃ 0.0738 · 1.209 0.0892
- Page 47 and 48: use may be advantageous not only in
- Page 49: To find the reasons for this disagr
- Page 53 and 54: EnergyPlus environment, we used mod
- Page 55 and 56: To keep future energy consumption d
- Page 57 and 58: A New Calculation Method to Analyse
- Page 59 and 60: On Fig. 3. can be seen the areas th
- Page 61 and 62: Present and Future of Geothermal En
- Page 63 and 64: TABLE II.THE TEMPERATURE DATA AND C
- Page 65 and 66: Error in Water Meter Measuring at W
- Page 67 and 68: III.RESULTS OF MEASURMENTSEach meas
- Page 69 and 70: TABLE I.THE AVERAGE VALUE OF THERMA
- Page 71 and 72: If the walls of the DHEs are made o
- Page 73 and 74: Environmental External Costs Associ
- Page 75 and 76: iodiesel production facility with a
- Page 77 and 78: Contribution of unit processesto ex
- Page 79 and 80: Heat Pump News in HungaryBéla Ád
- Page 81 and 82: Thermal Comfort Measurements In Lar
- Page 83 and 84: IV.DISCUSSIONThe sample frequencies
- Page 85 and 86: For a Clear View of Traditional and
- Page 87 and 88: esults in geographically distribute
- Page 89 and 90: Design of a Solar Hybrid SystemMari
- Page 91 and 92: Maintaining the set point temperatu
- Page 93 and 94: Decision system theory model of ope
- Page 95 and 96: parameter of pump in the function o
- Page 97 and 98: Importance and Value of Predictive
- Page 99 and 100: D. Overview of existing boiler oper
- Page 101 and 102:
HEAVY FUEL OIL FIRED, STEAMNATURAL
- Page 103 and 104:
MATHEMATICAL MODEL AND NUMERICAL SI
- Page 105 and 106:
C. Energy balance equationMathemati
- Page 107 and 108:
Discretization energy balance equat
- Page 109 and 110:
T ulf=32 º C, A - m =0.00162 kg/s,
- Page 111 and 112:
Comparison of Heat Pump and MicroCH
- Page 113 and 114:
the microCHP development. The energ
- Page 115 and 116:
control and stabilizer must be deve
- Page 117 and 118:
In Figure 1, in relation to the ord
- Page 119 and 120:
NPCC BHXOBYNI x1I x2I x3I x4LO YKYO
- Page 121 and 122:
exchange, as in reality, economies
- Page 123 and 124:
esponsibilities for consequences, o
- Page 125 and 126:
Coca-Cola Enterprise Inc had approx
- Page 127 and 128:
Flow Pattern Map for In Tube Evapor
- Page 129 and 130:
circumference with a liquid film. T
- Page 131 and 132:
Tube diameter: d 6 mm W Heat flux
- Page 133 and 134:
Realization of Concurrent Programmi
- Page 135 and 136:
applications the development, optim
- Page 137 and 138:
Renewable energy sources in automob
- Page 139 and 140:
commercial arrays can be built at b
- Page 141 and 142:
of multiple thin films produced usi
- Page 143:
EXPRES 20124 th International Sympo