Final Program EXPRES 2012 - Conferences
Final Program EXPRES 2012 - Conferences
Final Program EXPRES 2012 - Conferences
- No tags were found...

Create successful ePaper yourself
Turn your PDF publications into a flip-book with our unique Google optimized e-Paper software.
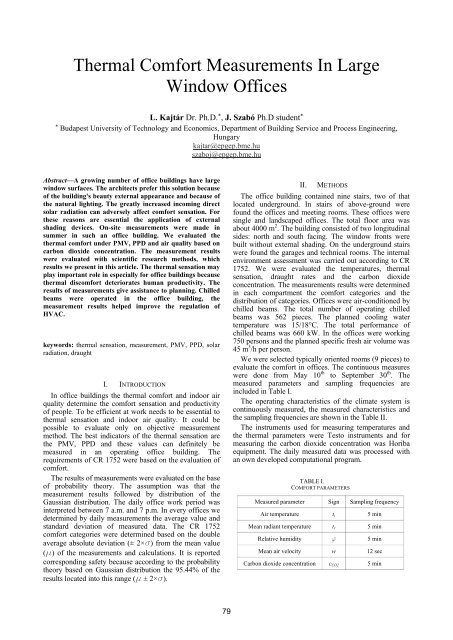
Thermal Comfort Measurements In LargeWindow OfficesL. Kajtár Dr. Ph.D. * , J. Szabó Ph.D student **Budapest University of Technology and Economics, Department of Building Service and Process Engineering,Hungarykajtar@epgep.bme.huszaboj@epgep.bme.huAbstract—A growing number of office buildings have largewindow surfaces. The architects prefer this solution becauseof the building's beauty external appearance and because ofthe natural lighting. The greatly increased incoming directsolar radiation can adversely affect comfort sensation. Forthese reasons are essential the application of externalshading devices. On-site measurements were made insummer in such an office building. We evaluated thethermal comfort under PMV, PPD and air quality based oncarbon dioxide concentration. The measurement resultswere evaluated with scientific research methods, whichresults we present in this article. The thermal sensation mayplay important role in especially for office buildings becausethermal discomfort deteriorates human productivity. Theresults of measurements give assistance to planning. Chilledbeams were operated in the office building, themeasurement results helped improve the regulation ofHVAC.keywords: thermal sensation, measurement, PMV, PPD, solarradiation, draughtI. INTRODUCTIONIn office buildings the thermal comfort and indoor airquality determine the comfort sensation and productivityof people. To be efficient at work needs to be essential tothermal sensation and indoor air quality. It could bepossible to evaluate only on objective measurementmethod. The best indicators of the thermal sensation arethe PMV, PPD and these values can definitely bemeasured in an operating office building. Therequirements of CR 1752 were based on the evaluation ofcomfort.The results of measurements were evaluated on the baseof probability theory. The assumption was that themeasurement results followed by distribution of theGaussian distribution. The daily office work period wasinterpreted between 7 a.m. and 7 p.m. In every offices wedetermined by daily measurements the average value andstandard deviation of measured data. The CR 1752comfort categories were determined based on the doubleaverage absolute deviation (± 2×s) from the mean value(m) of the measurements and calculations. It is reportedcorresponding safety because according to the probabilitytheory based on Gaussian distribution the 95.44% of theresults located into this range (m ± 2×s).II.METHODSThe office building contained nine stairs, two of thatlocated underground. In stairs of above-ground werefound the offices and meeting rooms. These offices weresingle and landscaped offices. The total floor area wasabout 4000 m 2 . The building consisted of two longitudinalsides: north and south facing. The window fronts werebuilt without external shading. On the underground stairswere found the garages and technical rooms. The internalenvironment assessment was carried out according to CR1752. We were evaluated the temperatures, thermalsensation, draught rates and the carbon dioxideconcentration. The measurements results were determinedin each compartment the comfort categories and thedistribution of categories. Offices were air-conditioned bychilled beams. The total number of operating chilledbeams was 562 pieces. The planned cooling watertemperature was 15/18°C. The total performance ofchilled beams was 660 kW. In the offices were working750 persons and the planned specific fresh air volume was45 m 3 /h per person.We were selected typically oriented rooms (9 pieces) toevaluate the comfort in offices. The continuous measureswere done from May 10 th to September 30 th . Themeasured parameters and sampling frequencies areincluded in Table I.The operating characteristics of the climate system iscontinuously measured, the measured characteristics andthe sampling frequencies are shown in the Table II.The instruments used for measuring temperatures andthe thermal parameters were Testo instruments and formeasuring the carbon dioxide concentration was Horibaequipment. The daily measured data was processed withan own developed computational program.TABLE I.COMFORT PARAMETERSMeasured parameter Sign Sampling frequencyAir temperature t i 5 minMean radiant temperature t r 5 minRelative humidity f 5 minMean air velocity w 12 secCarbon dioxide concentration c CO2 5 min79