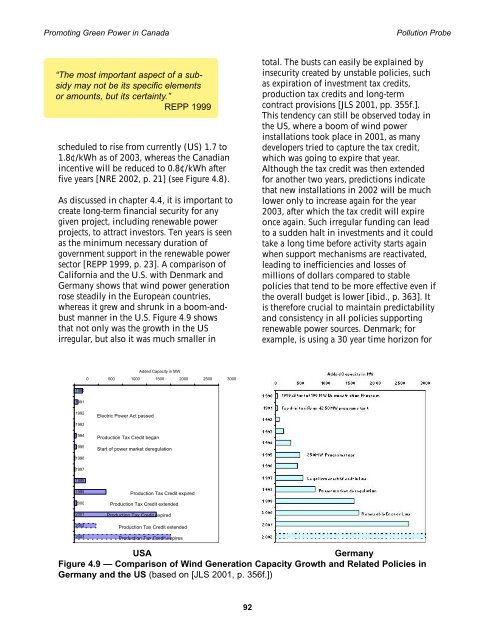
<strong>Promot<strong>in</strong>g</strong> <strong>Green</strong> <strong>Power</strong> <strong>in</strong> <strong>Canada</strong> Pollution Probe“The most important aspect of a subsidymay not be its specific elementsor amounts, but its certa<strong>in</strong>ty.”REPP 1999scheduled to rise from currently (US) 1.7 to1.8¢/kWh as of 2003, whereas the Canadian<strong>in</strong>centive will be reduced to 0.8¢/kWh afterfive years [NRE 2002, p. 21] (see Figure 4.8).As discussed <strong>in</strong> chapter 4.4, it is important tocreate long-term f<strong>in</strong>ancial security <strong>for</strong> anygiven project, <strong>in</strong>clud<strong>in</strong>g renewable powerprojects, to attract <strong>in</strong>vestors. Ten years is seenas the m<strong>in</strong>imum necessary duration ofgovernment support <strong>in</strong> the renewable powersector [REPP 1999, p. 23]. A comparison ofCali<strong>for</strong>nia and the U.S. with Denmark andGermany shows that w<strong>in</strong>d power generationrose steadily <strong>in</strong> the European countries,whereas it grew and shrunk <strong>in</strong> a boom-andbustmanner <strong>in</strong> the U.S. Figure 4.9 showsthat not only was the growth <strong>in</strong> the USirregular, but also it was much smaller <strong>in</strong>total. The busts can easily be expla<strong>in</strong>ed by<strong>in</strong>security created by unstable policies, suchas expiration of <strong>in</strong>vestment tax credits,production tax credits and long-termcontract provisions [JLS 2001, pp. 355f.].This tendency can still be observed today <strong>in</strong>the US, where a boom of w<strong>in</strong>d power<strong>in</strong>stallations took place <strong>in</strong> 2001, as manydevelopers tried to capture the tax credit,which was go<strong>in</strong>g to expire that year.Although the tax credit was then extended<strong>for</strong> another two years, predictions <strong>in</strong>dicatethat new <strong>in</strong>stallations <strong>in</strong> 2002 will be muchlower only to <strong>in</strong>crease aga<strong>in</strong> <strong>for</strong> the year2003, after which the tax credit will expireonce aga<strong>in</strong>. Such irregular fund<strong>in</strong>g can leadto a sudden halt <strong>in</strong> <strong>in</strong>vestments and it couldtake a long time be<strong>for</strong>e activity starts aga<strong>in</strong>when support mechanisms are reactivated,lead<strong>in</strong>g to <strong>in</strong>efficiencies and losses ofmillions of dollars compared to stablepolicies that tend to be more effective even ifthe overall budget is lower [ibid., p. 363]. Itis there<strong>for</strong>e crucial to ma<strong>in</strong>ta<strong>in</strong> predictabilityand consistency <strong>in</strong> all policies support<strong>in</strong>grenewable power sources. Denmark; <strong>for</strong>example, is us<strong>in</strong>g a 30 year time horizon <strong>for</strong>Added Capacity <strong>in</strong> MW0 500 1000 1500 2000 2500 3000199019911992199319941995Electric <strong>Power</strong> Act passedProduction Tax Credit beganStart of power market deregulation19961997199819992000200120022003Production Tax Credit expiredProduction Tax Credit extendedProduction Tax Credit expiredProduction Tax Credit extendedProduction Tax Credit expiresUSA GermanyFigure 4.9 — Comparison of W<strong>in</strong>d Generation Capacity Growth and Related Policies <strong>in</strong>Germany and the US (based on [JLS 2001, p. 356f.])92
<strong>Promot<strong>in</strong>g</strong> <strong>Green</strong> <strong>Power</strong> <strong>in</strong> <strong>Canada</strong> Pollution Probeits renewable power policies to ensureconsistency <strong>in</strong> policy and to give certa<strong>in</strong>ty tomarket participants about the scenario <strong>in</strong>which they will operate [ibid.].Interest<strong>in</strong>gly, some countries are nowwithdraw<strong>in</strong>g their support <strong>for</strong> renewablepower. Tax exemptions have been taken awayfrom large hydro electricity <strong>in</strong> both Germanyand the Netherlands, and even morenotable, Denmark is no longer support<strong>in</strong>gw<strong>in</strong>d energy, claim<strong>in</strong>g it is now a maturetechnology that can compete <strong>in</strong> the market.W<strong>in</strong>d is also very competitive <strong>in</strong> the UK,which has very good w<strong>in</strong>d resources andproduces w<strong>in</strong>d electricity at half the price itcosts <strong>in</strong> cont<strong>in</strong>ental Europe. In the US, theNational Resources Defence Council nowagrees with the Competitive EnterpriseInstitute that subsidies <strong>for</strong> w<strong>in</strong>d turb<strong>in</strong>es areno longer necessary as w<strong>in</strong>d is a“commercially proven” technology [CEI 2002].Apart from the price per kWh, the high<strong>in</strong>vestment cost of renewable power projects— as opposed to lower operat<strong>in</strong>g cost — is aconcern when foster<strong>in</strong>g its deployment.Several countries have addressed this barrierby provid<strong>in</strong>g cheap loans or grants torenewable power projects. In F<strong>in</strong>land, newrenewable projects are eligible <strong>for</strong> grantsequivalent to between 10% and 35% of<strong>in</strong>vestment costs [NREL 2002, p. 24]. Swedenprovides grants of between 15 and 25% of<strong>in</strong>vestment costs to new w<strong>in</strong>d power, smallhydro and biomass plants [HAAS 2001, p. 23].Germany provides cheap loans to renewablepower projects up to 50% of <strong>in</strong>vestmentcosts through the Deutsche Ausgleichsbank.Spa<strong>in</strong> provides grants of between 10 and40% to renewable power projects (w<strong>in</strong>d andbiomass) [ENER 1998]. The UK, which didnot have a grant program <strong>for</strong> renewablepower under the NFFO, now providesgenerous capital grants <strong>for</strong> offshore w<strong>in</strong>dand energy crops (see chapter 3.4.2).Concern<strong>in</strong>g distributed generation, theCali<strong>for</strong>nia buy-down program providesA capital grant of 25% of theequipment cost will make numerousrenewable energy projects pricecompetitivewith conventionalelectricity production.<strong>in</strong>centives to <strong>in</strong>stall w<strong>in</strong>d, PV, solar thermaland fuel cell systems and offers to supportup to 50% of the <strong>in</strong>vestment (see theCali<strong>for</strong>nia Energy Commission’s website).Germany’s 1,000 Rooftop Program <strong>in</strong> the1990’s subsidized an average 70% of<strong>in</strong>vestment costs <strong>for</strong> PV systems [HAAS 2001,p. 17]. The Canadian federal governmentalso provides a 25% capital cost rebate <strong>for</strong>solar and biomass thermal technologies[PAPE 1999a, p. 8]. The capital cost ofrenewable power projects often accounts <strong>for</strong>70% of the price of electricity [REPP 1999, p.15], so a capital grant of 25% can reduce theprice of electricity generation by 17.5% — <strong>in</strong>many cases enough to make it competitivewith fossil fuel-based generation. Investmenttax credits <strong>in</strong> Cali<strong>for</strong>nia, <strong>for</strong> example, havecontributed to the rapid <strong>in</strong>crease <strong>in</strong> w<strong>in</strong>dturb<strong>in</strong>e efficiencies <strong>in</strong> the U.S., and are saidto be more effective than the Federal w<strong>in</strong>dR&D program <strong>in</strong> achiev<strong>in</strong>g improvement <strong>in</strong>w<strong>in</strong>d power technology [ASMUS 2002, p. 7].<strong>Canada</strong>’s Market Incentive Program is an<strong>in</strong>itiative to support green power market<strong>in</strong>gand can cover up to 40% of eligiblemarket<strong>in</strong>g (not capital) cost. The jo<strong>in</strong>tNatural Resources <strong>Canada</strong>/Environment<strong>Canada</strong> Program is funded with $25 million,end<strong>in</strong>g <strong>in</strong> March 2006 [NRCan 2002b].Several governments support research anddevelopment of renewable power systems(see Table 4.12 <strong>for</strong> a comparison between<strong>Canada</strong> and some other countries). It isobvious that European support <strong>for</strong> renewableelectricity is far larger than <strong>in</strong> <strong>Canada</strong>concern<strong>in</strong>g R&D, grants and loans, and<strong>in</strong>centives. As described <strong>in</strong> detail <strong>in</strong> Chapter 3,93