Promoting Green Power in Canada - Centre for Human Settlements
Promoting Green Power in Canada - Centre for Human Settlements
Promoting Green Power in Canada - Centre for Human Settlements
- No tags were found...

Create successful ePaper yourself
Turn your PDF publications into a flip-book with our unique Google optimized e-Paper software.
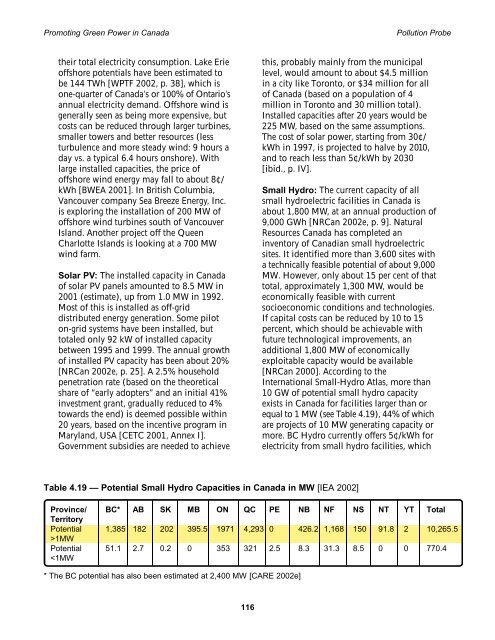
<strong>Promot<strong>in</strong>g</strong> <strong>Green</strong> <strong>Power</strong> <strong>in</strong> <strong>Canada</strong> Pollution Probetheir total electricity consumption. Lake Erieoffshore potentials have been estimated tobe 144 TWh [WPTF 2002, p. 38], which isone-quarter of <strong>Canada</strong>’s or 100% of Ontario’sannual electricity demand. Offshore w<strong>in</strong>d isgenerally seen as be<strong>in</strong>g more expensive, butcosts can be reduced through larger turb<strong>in</strong>es,smaller towers and better resources (lessturbulence and more steady w<strong>in</strong>d: 9 hours aday vs. a typical 6.4 hours onshore). Withlarge <strong>in</strong>stalled capacities, the price ofoffshore w<strong>in</strong>d energy may fall to about 8¢/kWh [BWEA 2001]. In British Columbia,Vancouver company Sea Breeze Energy, Inc.is explor<strong>in</strong>g the <strong>in</strong>stallation of 200 MW ofoffshore w<strong>in</strong>d turb<strong>in</strong>es south of VancouverIsland. Another project off the QueenCharlotte Islands is look<strong>in</strong>g at a 700 MWw<strong>in</strong>d farm.Solar PV: The <strong>in</strong>stalled capacity <strong>in</strong> <strong>Canada</strong>of solar PV panels amounted to 8.5 MW <strong>in</strong>2001 (estimate), up from 1.0 MW <strong>in</strong> 1992.Most of this is <strong>in</strong>stalled as off-griddistributed energy generation. Some piloton-grid systems have been <strong>in</strong>stalled, buttotaled only 92 kW of <strong>in</strong>stalled capacitybetween 1995 and 1999. The annual growthof <strong>in</strong>stalled PV capacity has been about 20%[NRCan 2002e, p. 25]. A 2.5% householdpenetration rate (based on the theoreticalshare of “early adopters” and an <strong>in</strong>itial 41%<strong>in</strong>vestment grant, gradually reduced to 4%towards the end) is deemed possible with<strong>in</strong>20 years, based on the <strong>in</strong>centive program <strong>in</strong>Maryland, USA [CETC 2001, Annex I].Government subsidies are needed to achievethis, probably ma<strong>in</strong>ly from the municipallevel, would amount to about $4.5 million<strong>in</strong> a city like Toronto, or $34 million <strong>for</strong> allof <strong>Canada</strong> (based on a population of 4million <strong>in</strong> Toronto and 30 million total).Installed capacities after 20 years would be225 MW, based on the same assumptions.The cost of solar power, start<strong>in</strong>g from 30¢/kWh <strong>in</strong> 1997, is projected to halve by 2010,and to reach less than 5¢/kWh by 2030[ibid., p. IV].Small Hydro: The current capacity of allsmall hydroelectric facilities <strong>in</strong> <strong>Canada</strong> isabout 1,800 MW, at an annual production of9,000 GWh [NRCan 2002e, p. 9]. NaturalResources <strong>Canada</strong> has completed an<strong>in</strong>ventory of Canadian small hydroelectricsites. It identified more than 3,600 sites witha technically feasible potential of about 9,000MW. However, only about 15 per cent of thattotal, approximately 1,300 MW, would beeconomically feasible with currentsocioeconomic conditions and technologies.If capital costs can be reduced by 10 to 15percent, which should be achievable withfuture technological improvements, anadditional 1,800 MW of economicallyexploitable capacity would be available[NRCan 2000]. Accord<strong>in</strong>g to theInternational Small-Hydro Atlas, more than10 GW of potential small hydro capacityexists <strong>in</strong> <strong>Canada</strong> <strong>for</strong> facilities larger than orequal to 1 MW (see Table 4.19), 44% of whichare projects of 10 MW generat<strong>in</strong>g capacity ormore. BC Hydro currently offers 5¢/kWh <strong>for</strong>electricity from small hydro facilities, whichTable 4.19 — Potential Small Hydro Capacities <strong>in</strong> <strong>Canada</strong> <strong>in</strong> MW [IEA 2002]Prov<strong>in</strong>ce/ BC* AB SK MB ON QC PE NB NF NS NT YT TotalTerritoryPotential 1,385 182 202 395.5 1971 4,293 0 426.2 1,168 150 91.8 2 10,265.5>1MWPotential 51.1 2.7 0.2 0 353 321 2.5 8.3 31.3 8.5 0 0 770.4