Promoting Green Power in Canada - Centre for Human Settlements
Promoting Green Power in Canada - Centre for Human Settlements
Promoting Green Power in Canada - Centre for Human Settlements
- No tags were found...

You also want an ePaper? Increase the reach of your titles
YUMPU automatically turns print PDFs into web optimized ePapers that Google loves.
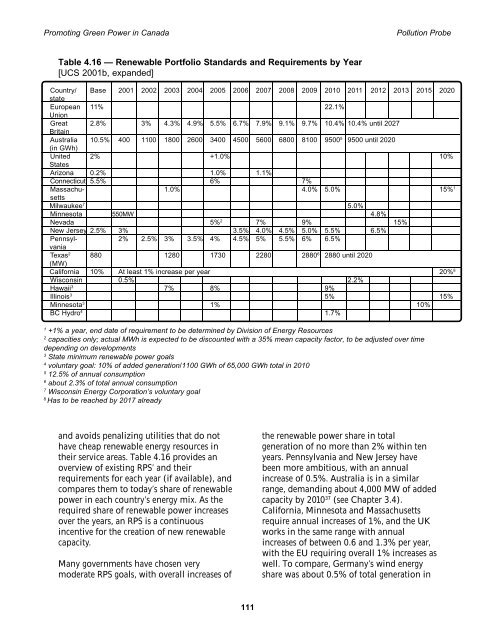
<strong>Promot<strong>in</strong>g</strong> <strong>Green</strong> <strong>Power</strong> <strong>in</strong> <strong>Canada</strong> Pollution ProbeTable 4.16 — Renewable Portfolio Standards and Requirements by Year[UCS 2001b, expanded]Country/ Base 2001 2002 2003 2004 2005 2006 2007 2008 2009 2010 2011 2012 2013 2015 2020stateEuropean 11% 22.1%UnionGreat 2.8% 3% 4.3% 4.9% 5.5% 6.7% 7.9% 9.1% 9.7% 10.4% 10.4% until 2027Brita<strong>in</strong>Australia 10.5% 400 1100 1800 2600 3400 4500 5600 6800 8100 9500 5 9500 until 2020(<strong>in</strong> GWh)United 2% +1.0% 10%StatesArizona 0.2% 1.0% 1.1%Connecticut 5.5% 6% 7%Massachu- 1.0% 4.0% 5.0% 15% 1settsMilwaukee 7 5.0%M<strong>in</strong>nesota 550MW 4.8%Nevada 5% 2 7% 9% 15%New Jersey 2.5% 3% 3.5% 4.0% 4.5% 5.0% 5.5% 6.5%Pennsyl- 2% 2.5% 3% 3.5% 4% 4.5% 5% 5.5% 6% 6.5%vaniaTexas 2 880 1280 1730 2280 2880 6 2880 until 2020(MW)Cali<strong>for</strong>nia 10% At least 1% <strong>in</strong>crease per year 20% 8Wiscons<strong>in</strong> 0.5% 2.2%Hawaii 3 7% 8% 9%Ill<strong>in</strong>ois 3 5% 15%M<strong>in</strong>nesota 3 1% 10%BC Hydro 4 1.7%1+1% a year, end date of requirement to be determ<strong>in</strong>ed by Division of Energy Resources2capacities only; actual MWh is expected to be discounted with a 35% mean capacity factor, to be adjusted over timedepend<strong>in</strong>g on developments3State m<strong>in</strong>imum renewable power goals4voluntary goal: 10% of added generation/1100 GWh of 65,000 GWh total <strong>in</strong> 2010512.5% of annual consumption6about 2.3% of total annual consumption7Wiscons<strong>in</strong> Energy Corporation’s voluntary goal8Has to be reached by 2017 alreadyand avoids penaliz<strong>in</strong>g utilities that do nothave cheap renewable energy resources <strong>in</strong>their service areas. Table 4.16 provides anoverview of exist<strong>in</strong>g RPS’ and theirrequirements <strong>for</strong> each year (if available), andcompares them to today’s share of renewablepower <strong>in</strong> each country’s energy mix. As therequired share of renewable power <strong>in</strong>creasesover the years, an RPS is a cont<strong>in</strong>uous<strong>in</strong>centive <strong>for</strong> the creation of new renewablecapacity.Many governments have chosen verymoderate RPS goals, with overall <strong>in</strong>creases ofthe renewable power share <strong>in</strong> totalgeneration of no more than 2% with<strong>in</strong> tenyears. Pennsylvania and New Jersey havebeen more ambitious, with an annual<strong>in</strong>crease of 0.5%. Australia is <strong>in</strong> a similarrange, demand<strong>in</strong>g about 4,000 MW of addedcapacity by 2010 37 (see Chapter 3.4).Cali<strong>for</strong>nia, M<strong>in</strong>nesota and Massachusettsrequire annual <strong>in</strong>creases of 1%, and the UKworks <strong>in</strong> the same range with annual<strong>in</strong>creases of between 0.6 and 1.3% per year,with the EU requir<strong>in</strong>g overall 1% <strong>in</strong>creases aswell. To compare, Germany’s w<strong>in</strong>d energyshare was about 0.5% of total generation <strong>in</strong>111