<strong>Promot<strong>in</strong>g</strong> <strong>Green</strong> <strong>Power</strong> <strong>in</strong> <strong>Canada</strong> Pollution ProbeWave energy: High potentials <strong>for</strong> waveenergy exist along both coasts. BC Hydro isdevelop<strong>in</strong>g the first wave energy project onVancouver Island at a pilot stage (4 MW).Two technologies (onshore and off shore)are be<strong>in</strong>g tested, and plans have been madeto expand the plant to 100 MW over thecom<strong>in</strong>g years if the technology workssuccessfully. The theoretical onshorepotential on Vancouver Island, based on thelength of the coastl<strong>in</strong>e and wave heights, hasbeen estimated to be about 8,000 MW (25TWh), and about the same on the QueenCharlotte Islands. 42 Currently, two suitablesites have been identified on VancouverIsland, where 400–500 MW of wave powerunits could be <strong>in</strong>stalled. Whereas theelectricity generation cost <strong>for</strong> the BC pilotproject will be 8¢/kWh, a larger projectcould achieve prices as low as 4.5¢/kWh. Thepotential at the East Coast is larger, ma<strong>in</strong>lyalong the coasts of Labrador and NovaScotia. Wave heights are about 2.2m at theWest Coast, and can be as high as 2.5m onthe Labrador coast and 1.7m <strong>in</strong> Nova Scotia.The overall East Coast onshore capacity canbe estimated to be twice as much as theWestern resources [PT 2002]. Offshoreresources are even larger, but currently arealso more expensive.Tidal barrage: The Canadian Annapolistidal power plant <strong>in</strong> the Bay of Fundy,between Nova Scotia and New Brunswick,was built <strong>in</strong> one of the few places <strong>in</strong> theworld where tides are <strong>in</strong> the order of 10metres, reach<strong>in</strong>g up to even 16 metres. Theplant, a low-head demonstration project, hasa nameplate capacity of 20 MW. Additionalpotential <strong>for</strong> tidal power <strong>in</strong> <strong>Canada</strong> exists <strong>in</strong>several locations, <strong>in</strong>clud<strong>in</strong>g four sites at theBC coast [TRI 2002]. Three sites <strong>in</strong> the Bay ofFundy are considered to have the besteconomic potential, with a total capacity of8,500 MW [NRCan 2002c, p. 111]. For twoconsidered projects (Cumberland and M<strong>in</strong>asBas<strong>in</strong>s), the electricity generation cost wasestimated to be between 4.9 and 7.6¢/kWh <strong>in</strong>1993, <strong>in</strong>clud<strong>in</strong>g transmission and re-tim<strong>in</strong>g(pumped storage) cost [WEC 1993, p. 10].There are problems with fish mortality andother ecological impacts <strong>in</strong> connection withtidal barrage concepts, which can be reducedus<strong>in</strong>g offshore plants, but probably makethis technology the least environmentallydesired option among ocean energytechnologies.Tidal current: The world’s first tidal currentdemonstration project was recently <strong>in</strong>stalled<strong>in</strong> Scotland on September 13, 2002. The 150kW turb<strong>in</strong>e, supported by the Britishgovernment, will be tested <strong>for</strong> one year andis situated at Yell Sound <strong>in</strong> the North ofScotland [EREN 2002(3)]. Its ecologicalimpacts would be smaller than those of tidalbarrages, and tidal current resources areamong the best <strong>in</strong> the world along the BCcoast. The estimated mean annualexploitable energy <strong>for</strong> the BC coast rangesfrom 2.7 TWh (1,550 MW <strong>in</strong>stalled at 20%capacity factor) <strong>for</strong> large scale <strong>in</strong>stallationswith exist<strong>in</strong>g technology to about 20 TWh(7,600 MW <strong>in</strong>stalled at 30% capacity factor)with realistic assumptions about near futuretechnology.Present tidal current energy generation costs,us<strong>in</strong>g demonstrated technology, appear to becompetitive with other green energy sources,at 11¢/kWh <strong>for</strong> a large site (800 MW<strong>in</strong>stalled capacity and 1.4 TWh/year). Thesecosts assume a conservative capacity factor of20% and a maximum current speed of 3.5m/s. Future energy costs are expected todecrease considerably as both exist<strong>in</strong>g andnew technologies are developed over thenext few years. Assum<strong>in</strong>g that maximumcurrents larger than 3.5 m/s can be exploitedand present design developments cont<strong>in</strong>ue,it is estimated that future tidal current energycosts between 5¢/kWh and 7¢/kWh areachievable. No detailed assessment has beendone <strong>for</strong> <strong>Canada</strong>’s east coast, but a similarpotential may exist there, especially alongthe Labrador coast, from which power l<strong>in</strong>eslead south. Assum<strong>in</strong>g 20 TWh <strong>for</strong> each coastat a 30% capacity factor, this would result <strong>in</strong>118
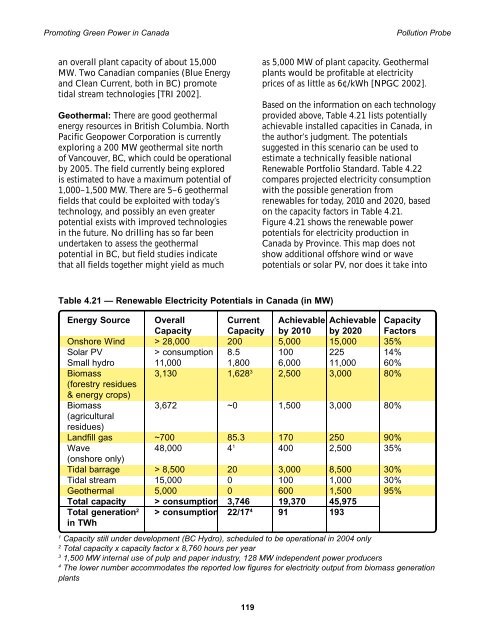
<strong>Promot<strong>in</strong>g</strong> <strong>Green</strong> <strong>Power</strong> <strong>in</strong> <strong>Canada</strong> Pollution Probean overall plant capacity of about 15,000MW. Two Canadian companies (Blue Energyand Clean Current, both <strong>in</strong> BC) promotetidal stream technologies [TRI 2002].Geothermal: There are good geothermalenergy resources <strong>in</strong> British Columbia. NorthPacific Geopower Corporation is currentlyexplor<strong>in</strong>g a 200 MW geothermal site northof Vancouver, BC, which could be operationalby 2005. The field currently be<strong>in</strong>g exploredis estimated to have a maximum potential of1,000–1,500 MW. There are 5–6 geothermalfields that could be exploited with today’stechnology, and possibly an even greaterpotential exists with improved technologies<strong>in</strong> the future. No drill<strong>in</strong>g has so far beenundertaken to assess the geothermalpotential <strong>in</strong> BC, but field studies <strong>in</strong>dicatethat all fields together might yield as muchas 5,000 MW of plant capacity. Geothermalplants would be profitable at electricityprices of as little as 6¢/kWh [NPGC 2002].Based on the <strong>in</strong><strong>for</strong>mation on each technologyprovided above, Table 4.21 lists potentiallyachievable <strong>in</strong>stalled capacities <strong>in</strong> <strong>Canada</strong>, <strong>in</strong>the author’s judgment. The potentialssuggested <strong>in</strong> this scenario can be used toestimate a technically feasible nationalRenewable Portfolio Standard. Table 4.22compares projected electricity consumptionwith the possible generation fromrenewables <strong>for</strong> today, 2010 and 2020, basedon the capacity factors <strong>in</strong> Table 4.21.Figure 4.21 shows the renewable powerpotentials <strong>for</strong> electricity production <strong>in</strong><strong>Canada</strong> by Prov<strong>in</strong>ce. This map does notshow additional offshore w<strong>in</strong>d or wavepotentials or solar PV, nor does it take <strong>in</strong>toTable 4.21 — Renewable Electricity Potentials <strong>in</strong> <strong>Canada</strong> (<strong>in</strong> MW)Energy Source Overall Current Achievable Achievable CapacityCapacity Capacity by 2010 by 2020 FactorsOnshore W<strong>in</strong>d > 28,000 200 5,000 15,000 35%Solar PV > consumption 8.5 100 225 14%Small hydro 11,000 1,800 6,000 11,000 60%Biomass 3,130 1,628 3 2,500 3,000 80%(<strong>for</strong>estry residues& energy crops)Biomass 3,672 ~0 1,500 3,000 80%(agriculturalresidues)Landfill gas ~700 85.3 170 250 90%Wave 48,000 4 1 400 2,500 35%(onshore only)Tidal barrage > 8,500 20 3,000 8,500 30%Tidal stream 15,000 0 100 1,000 30%Geothermal 5,000 0 600 1,500 95%Total capacity > consumption 3,746 19,370 45,975Total generation 2 > consumption 22/17 4 91 193<strong>in</strong> TWh1Capacity still under development (BC Hydro), scheduled to be operational <strong>in</strong> 2004 only2Total capacity x capacity factor x 8,760 hours per year31,500 MW <strong>in</strong>ternal use of pulp and paper <strong>in</strong>dustry, 128 MW <strong>in</strong>dependent power producers4The lower number accommodates the reported low figures <strong>for</strong> electricity output from biomass generationplants119