Promoting Green Power in Canada - Centre for Human Settlements
Promoting Green Power in Canada - Centre for Human Settlements
Promoting Green Power in Canada - Centre for Human Settlements
- No tags were found...

You also want an ePaper? Increase the reach of your titles
YUMPU automatically turns print PDFs into web optimized ePapers that Google loves.
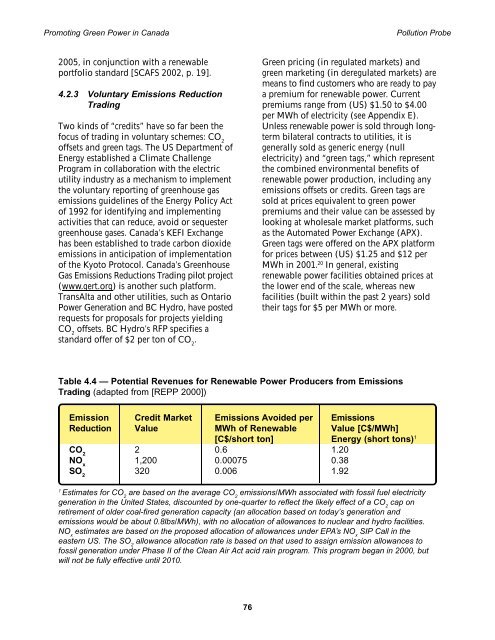
<strong>Promot<strong>in</strong>g</strong> <strong>Green</strong> <strong>Power</strong> <strong>in</strong> <strong>Canada</strong> Pollution Probe2005, <strong>in</strong> conjunction with a renewableportfolio standard [SCAFS 2002, p. 19].4.2.3 Voluntary Emissions ReductionTrad<strong>in</strong>gTwo k<strong>in</strong>ds of “credits” have so far been thefocus of trad<strong>in</strong>g <strong>in</strong> voluntary schemes: CO 2offsets and green tags. The US Department ofEnergy established a Climate ChallengeProgram <strong>in</strong> collaboration with the electricutility <strong>in</strong>dustry as a mechanism to implementthe voluntary report<strong>in</strong>g of greenhouse gasemissions guidel<strong>in</strong>es of the Energy Policy Actof 1992 <strong>for</strong> identify<strong>in</strong>g and implement<strong>in</strong>gactivities that can reduce, avoid or sequestergreenhouse gases. <strong>Canada</strong>’s KEFI Exchangehas been established to trade carbon dioxideemissions <strong>in</strong> anticipation of implementationof the Kyoto Protocol. <strong>Canada</strong>’s <strong>Green</strong>houseGas Emissions Reductions Trad<strong>in</strong>g pilot project(www.gert.org) is another such plat<strong>for</strong>m.TransAlta and other utilities, such as Ontario<strong>Power</strong> Generation and BC Hydro, have postedrequests <strong>for</strong> proposals <strong>for</strong> projects yield<strong>in</strong>gCO 2offsets. BC Hydro’s RFP specifies astandard offer of $2 per ton of CO 2.<strong>Green</strong> pric<strong>in</strong>g (<strong>in</strong> regulated markets) andgreen market<strong>in</strong>g (<strong>in</strong> deregulated markets) aremeans to f<strong>in</strong>d customers who are ready to paya premium <strong>for</strong> renewable power. Currentpremiums range from (US) $1.50 to $4.00per MWh of electricity (see Appendix E).Unless renewable power is sold through longtermbilateral contracts to utilities, it isgenerally sold as generic energy (nullelectricity) and “green tags,” which representthe comb<strong>in</strong>ed environmental benefits ofrenewable power production, <strong>in</strong>clud<strong>in</strong>g anyemissions offsets or credits. <strong>Green</strong> tags aresold at prices equivalent to green powerpremiums and their value can be assessed bylook<strong>in</strong>g at wholesale market plat<strong>for</strong>ms, suchas the Automated <strong>Power</strong> Exchange (APX).<strong>Green</strong> tags were offered on the APX plat<strong>for</strong>m<strong>for</strong> prices between (US) $1.25 and $12 perMWh <strong>in</strong> 2001. 20 In general, exist<strong>in</strong>grenewable power facilities obta<strong>in</strong>ed prices atthe lower end of the scale, whereas newfacilities (built with<strong>in</strong> the past 2 years) soldtheir tags <strong>for</strong> $5 per MWh or more.Table 4.4 — Potential Revenues <strong>for</strong> Renewable <strong>Power</strong> Producers from EmissionsTrad<strong>in</strong>g (adapted from [REPP 2000])Emission Credit Market Emissions Avoided per EmissionsReduction Value MWh of Renewable Value [C$/MWh][C$/short ton] Energy (short tons) 1CO 22 0.6 1.20NO x1,200 0.00075 0.38SO 2320 0.006 1.921Estimates <strong>for</strong> CO 2are based on the average CO 2emissions/MWh associated with fossil fuel electricitygeneration <strong>in</strong> the United States, discounted by one-quarter to reflect the likely effect of a CO 2cap onretirement of older coal-fired generation capacity (an allocation based on today’s generation andemissions would be about 0.8lbs/MWh), with no allocation of allowances to nuclear and hydro facilities.NO xestimates are based on the proposed allocation of allowances under EPA’s NO xSIP Call <strong>in</strong> theeastern US. The SO 2allowance allocation rate is based on that used to assign emission allowances tofossil generation under Phase II of the Clean Air Act acid ra<strong>in</strong> program. This program began <strong>in</strong> 2000, butwill not be fully effective until 2010.76