Promoting Green Power in Canada - Centre for Human Settlements
Promoting Green Power in Canada - Centre for Human Settlements
Promoting Green Power in Canada - Centre for Human Settlements
- No tags were found...

Create successful ePaper yourself
Turn your PDF publications into a flip-book with our unique Google optimized e-Paper software.
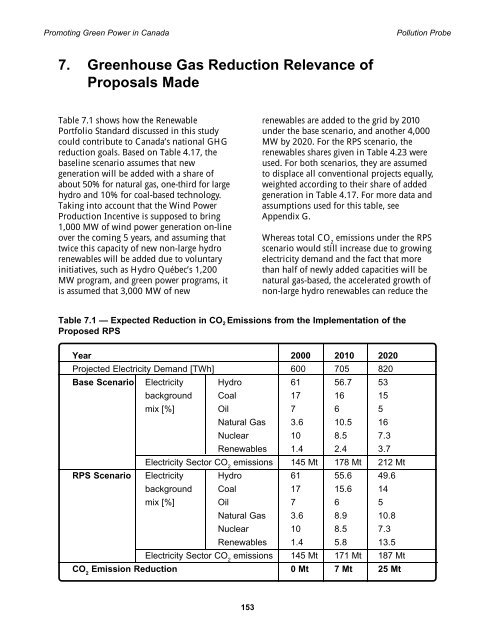
<strong>Promot<strong>in</strong>g</strong> <strong>Green</strong> <strong>Power</strong> <strong>in</strong> <strong>Canada</strong> Pollution Probe7. <strong>Green</strong>house Gas Reduction Relevance ofProposals MadeTable 7.1 shows how the RenewablePortfolio Standard discussed <strong>in</strong> this studycould contribute to <strong>Canada</strong>’s national GHGreduction goals. Based on Table 4.17, thebasel<strong>in</strong>e scenario assumes that newgeneration will be added with a share ofabout 50% <strong>for</strong> natural gas, one-third <strong>for</strong> largehydro and 10% <strong>for</strong> coal-based technology.Tak<strong>in</strong>g <strong>in</strong>to account that the W<strong>in</strong>d <strong>Power</strong>Production Incentive is supposed to br<strong>in</strong>g1,000 MW of w<strong>in</strong>d power generation on-l<strong>in</strong>eover the com<strong>in</strong>g 5 years, and assum<strong>in</strong>g thattwice this capacity of new non-large hydrorenewables will be added due to voluntary<strong>in</strong>itiatives, such as Hydro Québec’s 1,200MW program, and green power programs, itis assumed that 3,000 MW of newrenewables are added to the grid by 2010under the base scenario, and another 4,000MW by 2020. For the RPS scenario, therenewables shares given <strong>in</strong> Table 4.23 wereused. For both scenarios, they are assumedto displace all conventional projects equally,weighted accord<strong>in</strong>g to their share of addedgeneration <strong>in</strong> Table 4.17. For more data andassumptions used <strong>for</strong> this table, seeAppendix G.Whereas total CO 2emissions under the RPSscenario would still <strong>in</strong>crease due to grow<strong>in</strong>gelectricity demand and the fact that morethan half of newly added capacities will benatural gas-based, the accelerated growth ofnon-large hydro renewables can reduce theTable 7.1 — Expected Reduction <strong>in</strong> CO 2 Emissions from the Implementation of theProposed RPSYear 2000 2010 2020Projected Electricity Demand [TWh] 600 705 820Base Scenario Electricity Hydro 61 56.7 53background Coal 17 16 15mix [%] Oil 7 6 5Natural Gas 3.6 10.5 16Nuclear 10 8.5 7.3Renewables 1.4 2.4 3.7Electricity Sector CO 2emissions 145 Mt 178 Mt 212 MtRPS Scenario Electricity Hydro 61 55.6 49.6background Coal 17 15.6 14mix [%] Oil 7 6 5Natural Gas 3.6 8.9 10.8Nuclear 10 8.5 7.3Renewables 1.4 5.8 13.5Electricity Sector CO 2emissions 145 Mt 171 Mt 187 MtCO 2Emission Reduction 0 Mt 7 Mt 25 Mt153