thesis - IRS, The Infrared Spectrograph
thesis - IRS, The Infrared Spectrograph
thesis - IRS, The Infrared Spectrograph
You also want an ePaper? Increase the reach of your titles
YUMPU automatically turns print PDFs into web optimized ePapers that Google loves.
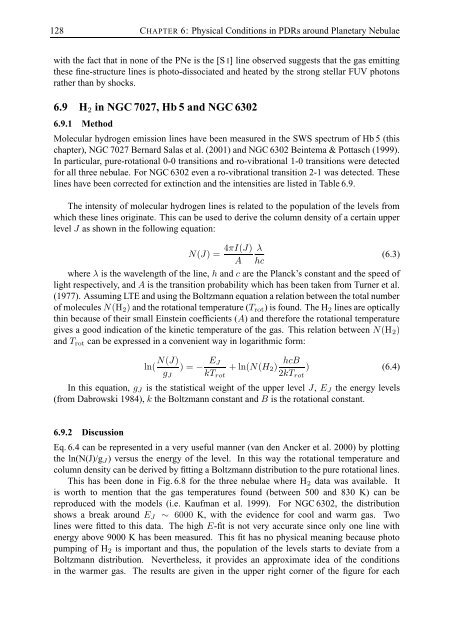
128 CHAPTER 6: Physical Conditions in PDRs around Planetary Nebulaewith the fact that in none of the PNe is the [S I] line observed suggests that the gas emittingthese fine-structure lines is photo-dissociated and heated by the strong stellar FUV photonsrather than by shocks.6.9 H 2 in NGC 7027, Hb 5 and NGC 63026.9.1 MethodMolecular hydrogen emission lines have been measured in the SWS spectrum of Hb 5 (thischapter), NGC 7027 Bernard Salas et al. (2001) and NGC 6302 Beintema & Pottasch (1999).In particular, pure-rotational 0-0 transitions and ro-vibrational 1-0 transitions were detectedfor all three nebulae. For NGC 6302 even a ro-vibrational transition 2-1 was detected. <strong>The</strong>selines have been corrected for extinction and the intensities are listed in Table 6.9.<strong>The</strong> intensity of molecular hydrogen lines is related to the population of the levels fromwhich these lines originate. This can be used to derive the column density of a certain upperlevel J as shown in the following equation:N(J) = 4πI(J) λ(6.3)A hcwhere λ is the wavelength of the line, h and c are the Planck’s constant and the speed oflight respectively, and A is the transition probability which has been taken from Turner et al.(1977). Assuming LTE and using the Boltzmann equation a relation between the total numberof molecules N(H 2 ) and the rotational temperature (T rot ) is found. <strong>The</strong> H 2 lines are opticallythin because of their small Einstein coefficients (A) and therefore the rotational temperaturegives a good indication of the kinetic temperature of the gas. This relation between N(H 2 )and T rot can be expressed in a convenient way in logarithmic form:ln( N(J) ) = − E J+ ln(N(H 2 ) hcB ) (6.4)g J kT rot 2kT rotIn this equation, g J is the statistical weight of the upper level J, E J the energy levels(from Dabrowski 1984), k the Boltzmann constant and B is the rotational constant.6.9.2 DiscussionEq. 6.4 can be represented in a very useful manner (van den Ancker et al. 2000) by plottingthe ln(N(J)/g J ) versus the energy of the level. In this way the rotational temperature andcolumn density can be derived by fitting a Boltzmann distribution to the pure rotational lines.This has been done in Fig. 6.8 for the three nebulae where H 2 data was available. Itis worth to mention that the gas temperatures found (between 500 and 830 K) can bereproduced with the models (i.e. Kaufman et al. 1999). For NGC 6302, the distributionshows a break around E J ∼ 6000 K, with the evidence for cool and warm gas. Twolines were fitted to this data. <strong>The</strong> high E-fit is not very accurate since only one line withenergy above 9000 K has been measured. This fit has no physical meaning because photopumping of H 2 is important and thus, the population of the levels starts to deviate from aBoltzmann distribution. Nevertheless, it provides an approximate idea of the conditionsin the warmer gas. <strong>The</strong> results are given in the upper right corner of the figure for each


