

thesis - IRS, The Infrared Spectrograph
thesis - IRS, The Infrared Spectrograph
thesis - IRS, The Infrared Spectrograph

Create successful ePaper yourself
Turn your PDF publications into a flip-book with our unique Google optimized e-Paper software.
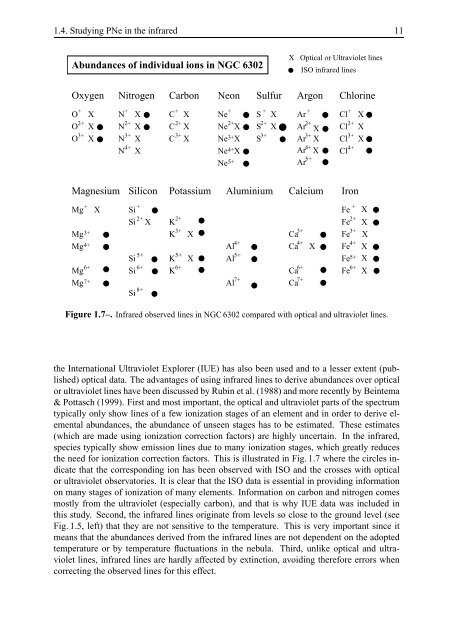
1.4. Studying PNe in the infrared 11Abundances of individual ions in NGC 6302X Optical or Ultraviolet linesISO infrared linesOxygenNitrogen Carbon Neon Sulfur Argon Chlorine+ + + + + + +O X N X C X Ne SO X N X C X2+Ne X S3+O X N X C X Ne X S4+N XNe4+XNe5+2+ 2+ 2+ 2+ 2+ 2+XXArArArXXAr4+ X5+ArClClClCl3+ 3+ 3+ 3+ 3+ 3+4+XXXMagnesium Silicon Potassium Aluminium Calcium IronMgMgMgMgMg+ + +XSiSiSiSiSiXKKKKXXAlAlCaCaCaCaXFeFeFeFeFeFe2+ 2+ 2+3+ 3+ 3+3+4+ 4+ 4+ 4+5+ 5+ 5+ 5+6+ 6+ 6+ 6+ 6+7+ 7+ 7+Al8+Figure 1.7–. <strong>Infrared</strong> observed lines in NGC 6302 compared with optical and ultraviolet lines.XXXXXXthe International Ultraviolet Explorer (IUE) has also been used and to a lesser extent (published)optical data. <strong>The</strong> advantages of using infrared lines to derive abundances over opticalor ultraviolet lines have been discussed by Rubin et al. (1988) and more recently by Beintema& Pottasch (1999). First and most important, the optical and ultraviolet parts of the spectrumtypically only show lines of a few ionization stages of an element and in order to derive elementalabundances, the abundance of unseen stages has to be estimated. <strong>The</strong>se estimates(which are made using ionization correction factors) are highly uncertain. In the infrared,species typically show emission lines due to many ionization stages, which greatly reducesthe need for ionization correction factors. This is illustrated in Fig. 1.7 where the circles indicatethat the corresponding ion has been observed with ISO and the crosses with opticalor ultraviolet observatories. It is clear that the ISO data is essential in providing informationon many stages of ionization of many elements. Information on carbon and nitrogen comesmostly from the ultraviolet (especially carbon), and that is why IUE data was included inthis study. Second, the infrared lines originate from levels so close to the ground level (seeFig. 1.5, left) that they are not sensitive to the temperature. This is very important since itmeans that the abundances derived from the infrared lines are not dependent on the adoptedtemperature or by temperature fluctuations in the nebula. Third, unlike optical and ultravioletlines, infrared lines are hardly affected by extinction, avoiding therefore errors whencorrecting the observed lines for this effect.


