

thesis - IRS, The Infrared Spectrograph
thesis - IRS, The Infrared Spectrograph
thesis - IRS, The Infrared Spectrograph

You also want an ePaper? Increase the reach of your titles
YUMPU automatically turns print PDFs into web optimized ePapers that Google loves.
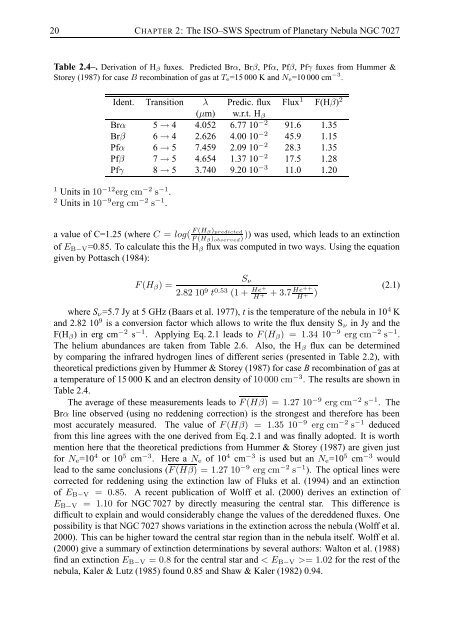
20 CHAPTER 2: <strong>The</strong> ISO–SWS Spectrum of Planetary Nebula NGC 7027Table 2.4–. Derivation of H β fluxes. Predicted Brα, Brβ, Pfα, Pfβ, Pfγ fluxes from Hummer &Storey (1987) for case B recombination of gas at T e=15 000 K and N e=10 000 cm −3 .Ident. Transition λ Predic. flux Flux 1 F(Hβ) 2(µm) w.r.t. H βBrα 5 → 4 4.052 6.77 10 −2 91.6 1.35Brβ 6 → 4 2.626 4.00 10 −2 45.9 1.15Pfα 6 → 5 7.459 2.09 10 −2 28.3 1.35Pfβ 7 → 5 4.654 1.37 10 −2 17.5 1.28Pfγ 8 → 5 3.740 9.20 10 −3 11.0 1.201 Units in 10 −12 erg cm −2 s −1 .2 Units in 10 −9 erg cm −2 s −1 .a value of C=1.25 (where C = log( F (H β) predictedF (H β ) observed ))) was used, which leads to an extinctionof E B−V =0.85. To calculate this the H β flux was computed in two ways. Using the equationgiven by Pottasch (1984):F (H β ) =S ν2.82 10 9 t 0.53 (1 + He+H ++ 3.7 He++H + )where S ν =5.7 Jy at 5 GHz (Baars et al. 1977), t is the temperature of the nebula in 10 4 Kand 2.82 10 9 is a conversion factor which allows to write the flux density S ν in Jy and theF(H β ) in erg cm −2 s −1 . Applying Eq. 2.1 leads to F (H β ) = 1.34 10 −9 erg cm −2 s −1 .<strong>The</strong> helium abundances are taken from Table 2.6. Also, the H β flux can be determinedby comparing the infrared hydrogen lines of different series (presented in Table 2.2), withtheoretical predictions given by Hummer & Storey (1987) for case B recombination of gas ata temperature of 15 000 K and an electron density of 10 000 cm −3 . <strong>The</strong> results are shown inTable 2.4.<strong>The</strong> average of these measurements leads to F (Hβ) = 1.27 10 −9 erg cm −2 s −1 . <strong>The</strong>Brα line observed (using no reddening correction) is the strongest and therefore has beenmost accurately measured. <strong>The</strong> value of F (Hβ) = 1.35 10 −9 erg cm −2 s −1 deducedfrom this line agrees with the one derived from Eq. 2.1 and was finally adopted. It is worthmention here that the theoretical predictions from Hummer & Storey (1987) are given justfor N e =10 4 or 10 5 cm −3 . Here a N e of 10 4 cm −3 is used but an N e =10 5 cm −3 wouldlead to the same conclusions (F (Hβ) = 1.27 10 −9 erg cm −2 s −1 ). <strong>The</strong> optical lines werecorrected for reddening using the extinction law of Fluks et al. (1994) and an extinctionof E B−V = 0.85. A recent publication of Wolff et al. (2000) derives an extinction ofE B−V = 1.10 for NGC 7027 by directly measuring the central star. This difference isdifficult to explain and would considerably change the values of the dereddened fluxes. Onepossibility is that NGC 7027 shows variations in the extinction across the nebula (Wolff et al.2000). This can be higher toward the central star region than in the nebula itself. Wolff et al.(2000) give a summary of extinction determinations by several authors: Walton et al. (1988)find an extinction E B−V = 0.8 for the central star and < E B−V >= 1.02 for the rest of thenebula, Kaler & Lutz (1985) found 0.85 and Shaw & Kaler (1982) 0.94.(2.1)


