

thesis - IRS, The Infrared Spectrograph
thesis - IRS, The Infrared Spectrograph
thesis - IRS, The Infrared Spectrograph

Create successful ePaper yourself
Turn your PDF publications into a flip-book with our unique Google optimized e-Paper software.
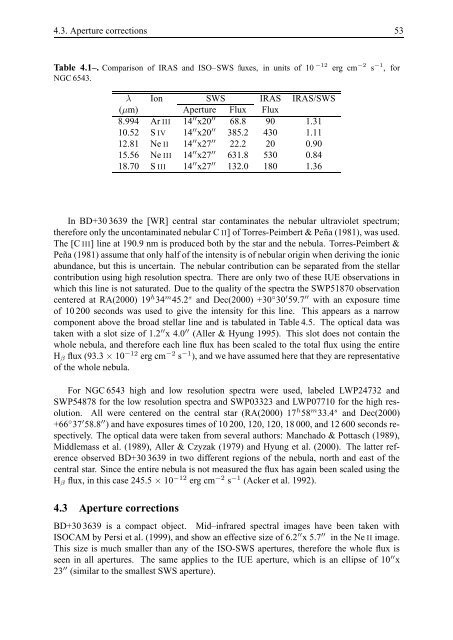
4.3. Aperture corrections 53Table 4.1–. Comparison of IRAS and ISO–SWS fluxes, in units of 10 −12 erg cm −2 s −1 , forNGC 6543.λ Ion SWS IRAS IRAS/SWS(µm) Aperture Flux Flux8.994 Ar III 14 ′′ x20 ′′ 68.8 90 1.3110.52 S IV 14 ′′ x20 ′′ 385.2 430 1.1112.81 Ne II 14 ′′ x27 ′′ 22.2 20 0.9015.56 Ne III 14 ′′ x27 ′′ 631.8 530 0.8418.70 S III 14 ′′ x27 ′′ 132.0 180 1.36In BD+30 3639 the [WR] central star contaminates the nebular ultraviolet spectrum;therefore only the uncontaminated nebular C II] of Torres-Peimbert & Peña (1981), was used.<strong>The</strong> [C III] line at 190.9 nm is produced both by the star and the nebula. Torres-Peimbert &Peña (1981) assume that only half of the intensity is of nebular origin when deriving the ionicabundance, but this is uncertain. <strong>The</strong> nebular contribution can be separated from the stellarcontribution using high resolution spectra. <strong>The</strong>re are only two of these IUE observations inwhich this line is not saturated. Due to the quality of the spectra the SWP51870 observationcentered at RA(2000) 19 h 34 m 45.2 s and Dec(2000) +30 ◦ 30 ′ 59.7 ′′ with an exposure timeof 10 200 seconds was used to give the intensity for this line. This appears as a narrowcomponent above the broad stellar line and is tabulated in Table 4.5. <strong>The</strong> optical data wastaken with a slot size of 1.2 ′′ x 4.0 ′′ (Aller & Hyung 1995). This slot does not contain thewhole nebula, and therefore each line flux has been scaled to the total flux using the entireH β flux (93.3 × 10 −12 erg cm −2 s −1 ), and we have assumed here that they are representativeof the whole nebula.For NGC 6543 high and low resolution spectra were used, labeled LWP24732 andSWP54878 for the low resolution spectra and SWP03323 and LWP07710 for the high resolution.All were centered on the central star (RA(2000) 17 h 58 m 33.4 s and Dec(2000)+66 ◦ 37 ′ 58.8 ′′ ) and have exposures times of 10 200, 120, 120, 18 000, and 12 600 seconds respectively.<strong>The</strong> optical data were taken from several authors: Manchado & Pottasch (1989),Middlemass et al. (1989), Aller & Czyzak (1979) and Hyung et al. (2000). <strong>The</strong> latter referenceobserved BD+30 3639 in two different regions of the nebula, north and east of thecentral star. Since the entire nebula is not measured the flux has again been scaled using theH β flux, in this case 245.5 × 10 −12 erg cm −2 s −1 (Acker et al. 1992).4.3 Aperture correctionsBD+30 3639 is a compact object. Mid–infrared spectral images have been taken withISOCAM by Persi et al. (1999), and show an effective size of 6.2 ′′ x 5.7 ′′ in the Ne II image.This size is much smaller than any of the ISO-SWS apertures, therefore the whole flux isseen in all apertures. <strong>The</strong> same applies to the IUE aperture, which is an ellipse of 10 ′′ x23 ′′ (similar to the smallest SWS aperture).


