

thesis - IRS, The Infrared Spectrograph
thesis - IRS, The Infrared Spectrograph
thesis - IRS, The Infrared Spectrograph

You also want an ePaper? Increase the reach of your titles
YUMPU automatically turns print PDFs into web optimized ePapers that Google loves.
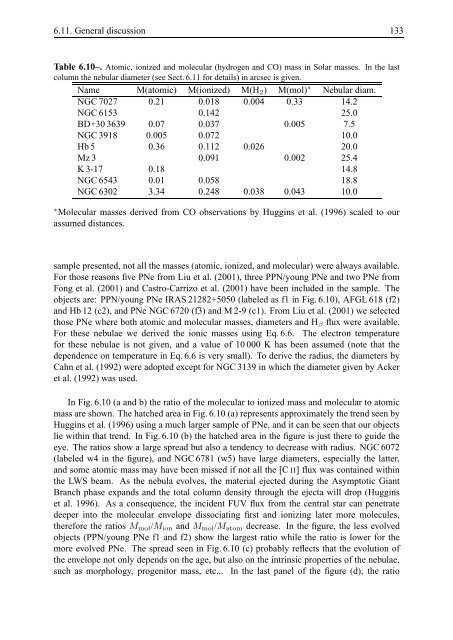
6.11. General discussion 133Table 6.10–. Atomic, ionized and molecular (hydrogen and CO) mass in Solar masses. In the lastcolumn the nebular diameter (see Sect. 6.11 for details) in arcsec is given.Name M(atomic) M(ionized) M(H 2 ) M(mol) ∗ Nebular diam.NGC 7027 0.21 0.018 0.004 0.33 14.2NGC 6153 0.142 25.0BD+30 3639 0.07 0.037 0.005 7.5NGC 3918 0.005 0.072 10.0Hb 5 0.36 0.112 0.026 20.0Mz 3 0.091 0.002 25.4K 3-17 0.18 14.8NGC 6543 0.01 0.058 18.8NGC 6302 3.34 0.248 0.038 0.043 10.0∗ Molecular masses derived from CO observations by Huggins et al. (1996) scaled to ourassumed distances.sample presented, not all the masses (atomic, ionized, and molecular) were always available.For those reasons five PNe from Liu et al. (2001), three PPN/young PNe and two PNe fromFong et al. (2001) and Castro-Carrizo et al. (2001) have been included in the sample. <strong>The</strong>objects are: PPN/young PNe IRAS 21282+5050 (labeled as f1 in Fig. 6.10), AFGL 618 (f2)and Hb 12 (c2), and PNe NGC 6720 (f3) and M 2-9 (c1). From Liu et al. (2001) we selectedthose PNe where both atomic and molecular masses, diameters and H β flux were available.For these nebulae we derived the ionic masses using Eq. 6.6. <strong>The</strong> electron temperaturefor these nebulae is not given, and a value of 10 000 K has been assumed (note that thedependence on temperature in Eq. 6.6 is very small). To derive the radius, the diameters byCahn et al. (1992) were adopted except for NGC 3139 in which the diameter given by Ackeret al. (1992) was used.In Fig. 6.10 (a and b) the ratio of the molecular to ionized mass and molecular to atomicmass are shown. <strong>The</strong> hatched area in Fig. 6.10 (a) represents approximately the trend seen byHuggins et al. (1996) using a much larger sample of PNe, and it can be seen that our objectslie within that trend. In Fig. 6.10 (b) the hatched area in the figure is just there to guide theeye. <strong>The</strong> ratios show a large spread but also a tendency to decrease with radius. NGC 6072(labeled w4 in the figure), and NGC 6781 (w5) have large diameters, especially the latter,and some atomic mass may have been missed if not all the [C II] flux was contained withinthe LWS beam. As the nebula evolves, the material ejected during the Asymptotic GiantBranch phase expands and the total column density through the ejecta will drop (Hugginset al. 1996). As a consequence, the incident FUV flux from the central star can penetratedeeper into the molecular envelope dissociating first and ionizing later more molecules,therefore the ratios M mol /M ion and M mol /M atom decrease. In the figure, the less evolvedobjects (PPN/young PNe f1 and f2) show the largest ratio while the ratio is lower for themore evolved PNe. <strong>The</strong> spread seen in Fig. 6.10 (c) probably reflects that the evolution ofthe envelope not only depends on the age, but also on the intrinsic properties of the nebulae,such as morphology, progenitor mass, etc... In the last panel of the figure (d), the ratio


