thesis - IRS, The Infrared Spectrograph
thesis - IRS, The Infrared Spectrograph
thesis - IRS, The Infrared Spectrograph
Create successful ePaper yourself
Turn your PDF publications into a flip-book with our unique Google optimized e-Paper software.
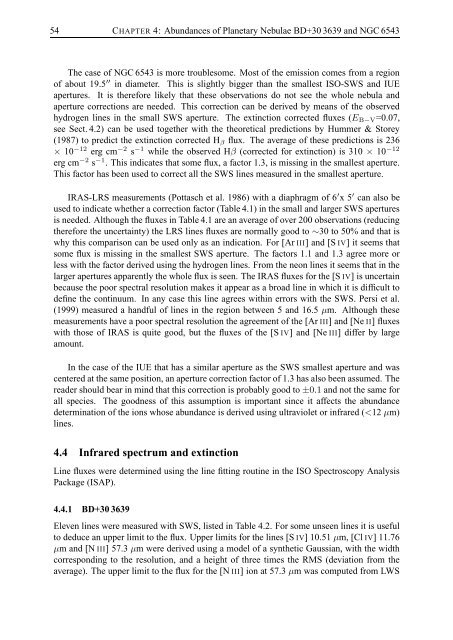
54 CHAPTER 4: Abundances of Planetary Nebulae BD+30 3639 and NGC 6543<strong>The</strong> case of NGC 6543 is more troublesome. Most of the emission comes from a regionof about 19.5 ′′ in diameter. This is slightly bigger than the smallest ISO-SWS and IUEapertures. It is therefore likely that these observations do not see the whole nebula andaperture corrections are needed. This correction can be derived by means of the observedhydrogen lines in the small SWS aperture. <strong>The</strong> extinction corrected fluxes (E B−V =0.07,see Sect. 4.2) can be used together with the theoretical predictions by Hummer & Storey(1987) to predict the extinction corrected H β flux. <strong>The</strong> average of these predictions is 236× 10 −12 erg cm −2 s −1 while the observed Hβ (corrected for extinction) is 310 × 10 −12erg cm −2 s −1 . This indicates that some flux, a factor 1.3, is missing in the smallest aperture.This factor has been used to correct all the SWS lines measured in the smallest aperture.IRAS-LRS measurements (Pottasch et al. 1986) with a diaphragm of 6 ′ x 5 ′ can also beused to indicate whether a correction factor (Table 4.1) in the small and larger SWS aperturesis needed. Although the fluxes in Table 4.1 are an average of over 200 observations (reducingtherefore the uncertainty) the LRS lines fluxes are normally good to ∼30 to 50% and that iswhy this comparison can be used only as an indication. For [Ar III] and [S IV] it seems thatsome flux is missing in the smallest SWS aperture. <strong>The</strong> factors 1.1 and 1.3 agree more orless with the factor derived using the hydrogen lines. From the neon lines it seems that in thelarger apertures apparently the whole flux is seen. <strong>The</strong> IRAS fluxes for the [S IV] is uncertainbecause the poor spectral resolution makes it appear as a broad line in which it is difficult todefine the continuum. In any case this line agrees within errors with the SWS. Persi et al.(1999) measured a handful of lines in the region between 5 and 16.5 µm. Although thesemeasurements have a poor spectral resolution the agreement of the [Ar III] and [Ne II] fluxeswith those of IRAS is quite good, but the fluxes of the [S IV] and [Ne III] differ by largeamount.In the case of the IUE that has a similar aperture as the SWS smallest aperture and wascentered at the same position, an aperture correction factor of 1.3 has also been assumed. <strong>The</strong>reader should bear in mind that this correction is probably good to ±0.1 and not the same forall species. <strong>The</strong> goodness of this assumption is important since it affects the abundancedetermination of the ions whose abundance is derived using ultraviolet or infrared (


