

thesis - IRS, The Infrared Spectrograph
thesis - IRS, The Infrared Spectrograph
thesis - IRS, The Infrared Spectrograph

Create successful ePaper yourself
Turn your PDF publications into a flip-book with our unique Google optimized e-Paper software.
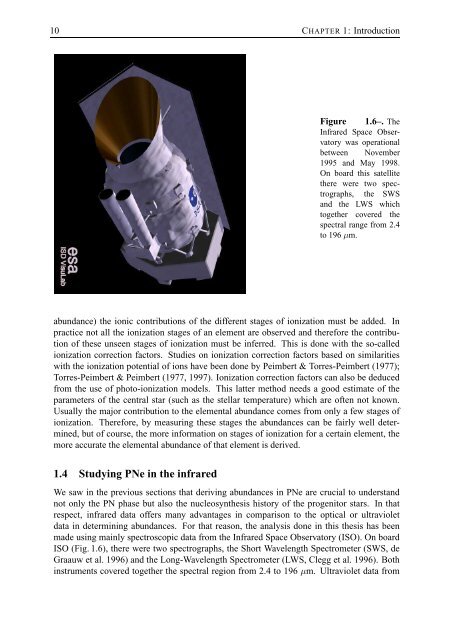
10 CHAPTER 1: IntroductionFigure 1.6–. <strong>The</strong><strong>Infrared</strong> Space Observatorywas operationalbetween November1995 and May 1998.On board this satellitethere were two spectrographs,the SWSand the LWS whichtogether covered thespectral range from 2.4to 196 µm.abundance) the ionic contributions of the different stages of ionization must be added. Inpractice not all the ionization stages of an element are observed and therefore the contributionof these unseen stages of ionization must be inferred. This is done with the so-calledionization correction factors. Studies on ionization correction factors based on similaritieswith the ionization potential of ions have been done by Peimbert & Torres-Peimbert (1977);Torres-Peimbert & Peimbert (1977, 1997). Ionization correction factors can also be deducedfrom the use of photo-ionization models. This latter method needs a good estimate of theparameters of the central star (such as the stellar temperature) which are often not known.Usually the major contribution to the elemental abundance comes from only a few stages ofionization. <strong>The</strong>refore, by measuring these stages the abundances can be fairly well determined,but of course, the more information on stages of ionization for a certain element, themore accurate the elemental abundance of that element is derived.1.4 Studying PNe in the infraredWe saw in the previous sections that deriving abundances in PNe are crucial to understandnot only the PN phase but also the nucleosyn<strong>thesis</strong> history of the progenitor stars. In thatrespect, infrared data offers many advantages in comparison to the optical or ultravioletdata in determining abundances. For that reason, the analysis done in this <strong>thesis</strong> has beenmade using mainly spectroscopic data from the <strong>Infrared</strong> Space Observatory (ISO). On boardISO (Fig. 1.6), there were two spectrographs, the Short Wavelength Spectrometer (SWS, deGraauw et al. 1996) and the Long-Wavelength Spectrometer (LWS, Clegg et al. 1996). Bothinstruments covered together the spectral region from 2.4 to 196 µm. Ultraviolet data from


