thesis - IRS, The Infrared Spectrograph
thesis - IRS, The Infrared Spectrograph
thesis - IRS, The Infrared Spectrograph
Create successful ePaper yourself
Turn your PDF publications into a flip-book with our unique Google optimized e-Paper software.
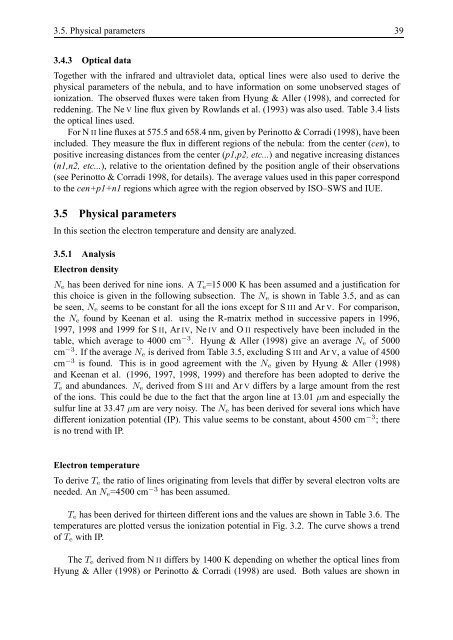
3.5. Physical parameters 393.4.3 Optical dataTogether with the infrared and ultraviolet data, optical lines were also used to derive thephysical parameters of the nebula, and to have information on some unobserved stages ofionization. <strong>The</strong> observed fluxes were taken from Hyung & Aller (1998), and corrected forreddening. <strong>The</strong> Ne V line flux given by Rowlands et al. (1993) was also used. Table 3.4 liststhe optical lines used.For N II line fluxes at 575.5 and 658.4 nm, given by Perinotto & Corradi (1998), have beenincluded. <strong>The</strong>y measure the flux in different regions of the nebula: from the center (cen), topositive increasing distances from the center (p1,p2, etc...) and negative increasing distances(n1,n2, etc...), relative to the orientation defined by the position angle of their observations(see Perinotto & Corradi 1998, for details). <strong>The</strong> average values used in this paper correspondto the cen+p1+n1 regions which agree with the region observed by ISO–SWS and IUE.3.5 Physical parametersIn this section the electron temperature and density are analyzed.3.5.1 AnalysisElectron densityN e has been derived for nine ions. A T e =15 000 K has been assumed and a justification forthis choice is given in the following subsection. <strong>The</strong> N e is shown in Table 3.5, and as canbe seen, N e seems to be constant for all the ions except for S III and Ar V. For comparison,the N e found by Keenan et al. using the R-matrix method in successive papers in 1996,1997, 1998 and 1999 for S II, Ar IV, Ne IV and O II respectively have been included in thetable, which average to 4000 cm −3 . Hyung & Aller (1998) give an average N e of 5000cm −3 . If the average N e is derived from Table 3.5, excluding S III and Ar V, a value of 4500cm −3 is found. This is in good agreement with the N e given by Hyung & Aller (1998)and Keenan et al. (1996, 1997, 1998, 1999) and therefore has been adopted to derive theT e and abundances. N e derived from S III and Ar V differs by a large amount from the restof the ions. This could be due to the fact that the argon line at 13.01 µm and especially thesulfur line at 33.47 µm are very noisy. <strong>The</strong> N e has been derived for several ions which havedifferent ionization potential (IP). This value seems to be constant, about 4500 cm −3 ; thereis no trend with IP.Electron temperatureTo derive T e the ratio of lines originating from levels that differ by several electron volts areneeded. An N e =4500 cm −3 has been assumed.T e has been derived for thirteen different ions and the values are shown in Table 3.6. <strong>The</strong>temperatures are plotted versus the ionization potential in Fig. 3.2. <strong>The</strong> curve shows a trendof T e with IP.<strong>The</strong> T e derived from N II differs by 1400 K depending on whether the optical lines fromHyung & Aller (1998) or Perinotto & Corradi (1998) are used. Both values are shown in


