

thesis - IRS, The Infrared Spectrograph
thesis - IRS, The Infrared Spectrograph
thesis - IRS, The Infrared Spectrograph

You also want an ePaper? Increase the reach of your titles
YUMPU automatically turns print PDFs into web optimized ePapers that Google loves.
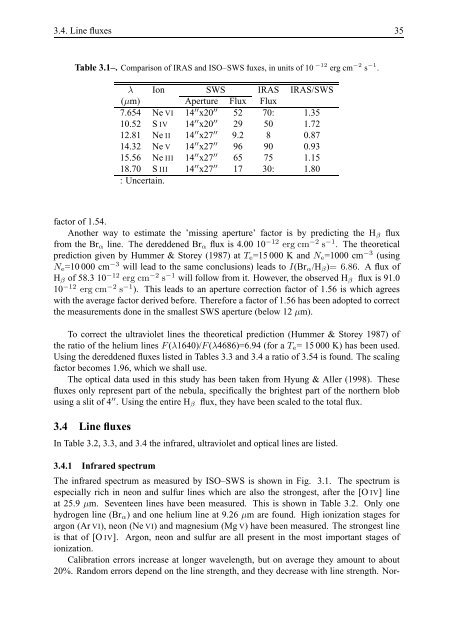
3.4. Line fluxes 35Table 3.1–. Comparison of IRAS and ISO–SWS fluxes, in units of 10 −12 erg cm −2 s −1 .λ Ion SWS IRAS IRAS/SWS(µm) Aperture Flux Flux7.654 Ne VI 14 ′′ x20 ′′ 52 70: 1.3510.52 S IV 14 ′′ x20 ′′ 29 50 1.7212.81 Ne II 14 ′′ x27 ′′ 9.2 8 0.8714.32 Ne V 14 ′′ x27 ′′ 96 90 0.9315.56 Ne III 14 ′′ x27 ′′ 65 75 1.1518.70 S III 14 ′′ x27 ′′ 17 30: 1.80: Uncertain.factor of 1.54.Another way to estimate the ’missing aperture’ factor is by predicting the H β fluxfrom the Br α line. <strong>The</strong> dereddened Br α flux is 4.00 10 −12 erg cm −2 s −1 . <strong>The</strong> theoreticalprediction given by Hummer & Storey (1987) at T e =15 000 K and N e =1000 cm −3 (usingN e =10 000 cm −3 will lead to the same conclusions) leads to I(Br α /H β )= 6.86. A flux ofH β of 58.3 10 −12 erg cm −2 s −1 will follow from it. However, the observed H β flux is 91.010 −12 erg cm −2 s −1 ). This leads to an aperture correction factor of 1.56 is which agreeswith the average factor derived before. <strong>The</strong>refore a factor of 1.56 has been adopted to correctthe measurements done in the smallest SWS aperture (below 12 µm).To correct the ultraviolet lines the theoretical prediction (Hummer & Storey 1987) ofthe ratio of the helium lines F (λ1640)/F (λ4686)=6.94 (for a T e = 15 000 K) has been used.Using the dereddened fluxes listed in Tables 3.3 and 3.4 a ratio of 3.54 is found. <strong>The</strong> scalingfactor becomes 1.96, which we shall use.<strong>The</strong> optical data used in this study has been taken from Hyung & Aller (1998). <strong>The</strong>sefluxes only represent part of the nebula, specifically the brightest part of the northern blobusing a slit of 4 ′′ . Using the entire H β flux, they have been scaled to the total flux.3.4 Line fluxesIn Table 3.2, 3.3, and 3.4 the infrared, ultraviolet and optical lines are listed.3.4.1 <strong>Infrared</strong> spectrum<strong>The</strong> infrared spectrum as measured by ISO–SWS is shown in Fig. 3.1. <strong>The</strong> spectrum isespecially rich in neon and sulfur lines which are also the strongest, after the [O IV] lineat 25.9 µm. Seventeen lines have been measured. This is shown in Table 3.2. Only onehydrogen line (Br α ) and one helium line at 9.26 µm are found. High ionization stages forargon (Ar VI), neon (Ne VI) and magnesium (Mg V) have been measured. <strong>The</strong> strongest lineis that of [O IV]. Argon, neon and sulfur are all present in the most important stages ofionization.Calibration errors increase at longer wavelength, but on average they amount to about20%. Random errors depend on the line strength, and they decrease with line strength. Nor-


