- Page 1 and 2:
RIJKSUNIVERSITEIT GRONINGENPhysics
- Page 3 and 4:
To my parents
- Page 5 and 6:
Contents1 Introduction 11.1 Evoluti
- Page 7 and 8:
CONTENTSvii5 Probing AGB nucleosynt
- Page 9 and 10:
1IntroductionPLANETARY NEBULAE are
- Page 11 and 12:
1.1. Evolution of low and intermedi
- Page 13 and 14:
1.2. Planetary Nebulae 5Flash−Dri
- Page 15 and 16:
1.3. Physics in PNe 7their whole li
- Page 17 and 18:
1.3. Physics in PNe 95.35 eVO IIIλ
- Page 19 and 20:
1.4. Studying PNe in the infrared 1
- Page 21 and 22:
2The ISO-SWS Spectrum ofPlanetary N
- Page 23 and 24:
2.3. Data reduction 15Table 2.1-. C
- Page 25 and 26:
2.4. Line flux discussion 17Table 2
- Page 27 and 28:
2.5. The visual and the ultraviolet
- Page 29:
2.6. Analysis 21Table 2.5-. Electro
- Page 32 and 33:
24 CHAPTER 2: The ISO-SWS Spectrum
- Page 34 and 35: 26 CHAPTER 2: The ISO-SWS Spectrum
- Page 36 and 37: 28 CHAPTER 2: The ISO-SWS Spectrum
- Page 39 and 40: 3An ISO and IUE study of PlanetaryN
- Page 41 and 42: 3.3. Corrections to line fluxes 33[
- Page 43 and 44: 3.4. Line fluxes 35Table 3.1-. Comp
- Page 45 and 46: Table 3.3-. IUE intensities, fluxes
- Page 47 and 48: 3.5. Physical parameters 393.4.3 Op
- Page 49 and 50: 3.5. Physical parameters 41Table 3.
- Page 51 and 52: 3.6. Chemical abundances 43Table 3.
- Page 53 and 54: 3.6. Chemical abundances 45Table 3.
- Page 55: 3.7. Conclusions 47Acknowledgements
- Page 58 and 59: 50 CHAPTER 4: Abundances of Planeta
- Page 60 and 61: 52 CHAPTER 4: Abundances of Planeta
- Page 62 and 63: 54 CHAPTER 4: Abundances of Planeta
- Page 64 and 65: 56 CHAPTER 4: Abundances of Planeta
- Page 66 and 67: 58 CHAPTER 4: Abundances of Planeta
- Page 68 and 69: 60 CHAPTER 4: Abundances of Planeta
- Page 70 and 71: 62 CHAPTER 4: Abundances of Planeta
- Page 72 and 73: 64 CHAPTER 4: Abundances of Planeta
- Page 74 and 75: 66 CHAPTER 4: Abundances of Planeta
- Page 77 and 78: 5Probing AGB nucleosynthesis viaacc
- Page 79 and 80: 5.1. Introduction 71about the synth
- Page 81 and 82: Table 5.2-. Radius, Zanstra tempera
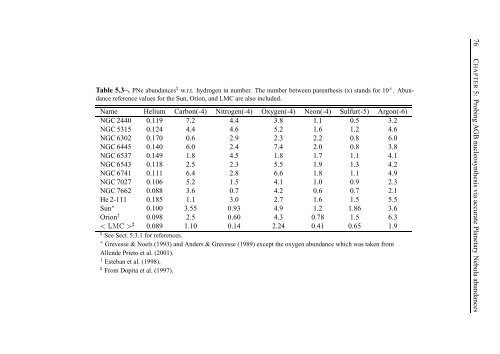
- Page 83: 5.3. Accurate abundances of ISO-obs
- Page 87 and 88: 5.4. Nucleosynthesis in low- and in
- Page 89 and 90: 5.5. Synthetic TP-AGB calculations
- Page 91 and 92: 5.6. Comparison between models and
- Page 93 and 94: 5.6. Comparison between models and
- Page 95 and 96: 5.6. Comparison between models and
- Page 97 and 98: 5.6. Comparison between models and
- Page 99 and 100: 5.6. Comparison between models and
- Page 101 and 102: 5.6. Comparison between models and
- Page 103 and 104: 5.6. Comparison between models and
- Page 105 and 106: 5.6. Comparison between models and
- Page 107 and 108: 5.6. Comparison between models and
- Page 109 and 110: 5.6. Comparison between models and
- Page 111 and 112: 5.7. Summary and conclusions 103Fig
- Page 113 and 114: 5.7. Summary and conclusions 105A s
- Page 115 and 116: 6Physical Conditions in PDRs around
- Page 117 and 118: 6.2. Observations 109are not promin
- Page 119 and 120: 6.4. General parameters of the PNe
- Page 121 and 122: 6.4. General parameters of the PNe
- Page 123 and 124: Table 6.3-. Radius, Zanstra tempera
- Page 125 and 126: 6.6. Lines fluxes 117Figure 6.2-. S
- Page 127 and 128: 6.7. Physical conditions of the PDR
- Page 129 and 130: 6.7. Physical conditions of the PDR
- Page 131 and 132: 6.7. Physical conditions of the PDR
- Page 133 and 134: 6.7. Physical conditions of the PDR
- Page 135 and 136:
6.8. PDRs versus Shocks 127Figure 6
- Page 137 and 138:
6.10. Atomic, ionized and molecular
- Page 139 and 140:
6.10. Atomic, ionized and molecular
- Page 141 and 142:
6.11. General discussion 133Table 6
- Page 143 and 144:
6.11. General discussion 135Figure
- Page 145 and 146:
6.12. Summary and Conclusions 137su
- Page 147 and 148:
7Conclusions and future workTHE res
- Page 149 and 150:
141• PNe with He/H > 0.14. The st
- Page 151 and 152:
143HERSCHEL The launch of this sate
- Page 153 and 154:
Nederlandse SamenvattingSTERREN wor
- Page 155 and 156:
Nederlandse Samenvatting 147Figuur
- Page 157 and 158:
Nederlandse Samenvatting 149PHOTOIO
- Page 159 and 160:
Nederlandse Samenvatting 151Figuur
- Page 161 and 162:
Nederlandse Samenvatting 153infraro
- Page 163 and 164:
English SummarySTARS are born, live
- Page 165 and 166:
English Summary 157Figure 2-. Two e
- Page 167 and 168:
English Summary 159PHOTOIONIZATIONR
- Page 169 and 170:
English Summary 161Figure 5-. Spect
- Page 171 and 172:
English Summary 163all) stages of i
- Page 173 and 174:
BibliographyAcker A., Marcout J., O
- Page 175 and 176:
BIBLIOGRAPHY 167Henry R.B.C., Kwitt
- Page 177 and 178:
BIBLIOGRAPHY 169Pottasch S.R., Bern
- Page 179 and 180:
List of PublicationsPublications in
- Page 181 and 182:
AcknowledgementsI could easily writ
- Page 183:
Acknowledgements 175sense of humor,