

thesis - IRS, The Infrared Spectrograph
thesis - IRS, The Infrared Spectrograph
thesis - IRS, The Infrared Spectrograph

You also want an ePaper? Increase the reach of your titles
YUMPU automatically turns print PDFs into web optimized ePapers that Google loves.
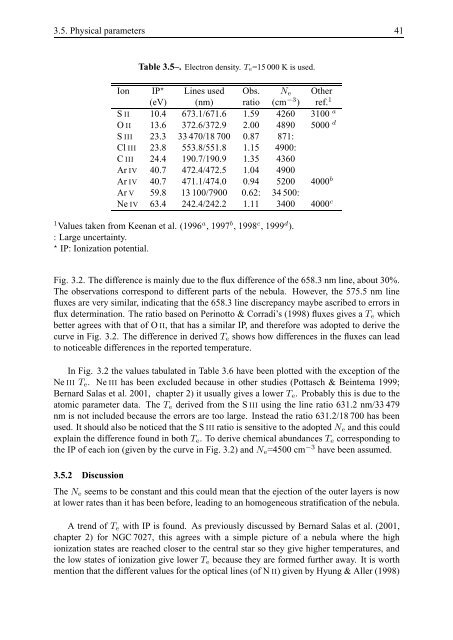
3.5. Physical parameters 41Table 3.5–. Electron density. T e=15 000 K is used.Ion IP ⋆ Lines used Obs. N e Other(eV) (nm) ratio (cm −3 ) ref. 1S II 10.4 673.1/671.6 1.59 4260 3100 aO II 13.6 372.6/372.9 2.00 4890 5000 dS III 23.3 33 470/18 700 0.87 871:Cl III 23.8 553.8/551.8 1.15 4900:C III 24.4 190.7/190.9 1.35 4360Ar IV 40.7 472.4/472.5 1.04 4900Ar IV 40.7 471.1/474.0 0.94 5200 4000 bAr V 59.8 13 100/7900 0.62: 34 500:Ne IV 63.4 242.4/242.2 1.11 3400 4000 c1 Values taken from Keenan et al. (1996 a , 1997 b , 1998 c , 1999 d ).: Large uncertainty.⋆ IP: Ionization potential.Fig. 3.2. <strong>The</strong> difference is mainly due to the flux difference of the 658.3 nm line, about 30%.<strong>The</strong> observations correspond to different parts of the nebula. However, the 575.5 nm linefluxes are very similar, indicating that the 658.3 line discrepancy maybe ascribed to errors influx determination. <strong>The</strong> ratio based on Perinotto & Corradi’s (1998) fluxes gives a T e whichbetter agrees with that of O II, that has a similar IP, and therefore was adopted to derive thecurve in Fig. 3.2. <strong>The</strong> difference in derived T e shows how differences in the fluxes can leadto noticeable differences in the reported temperature.In Fig. 3.2 the values tabulated in Table 3.6 have been plotted with the exception of theNe III T e . Ne III has been excluded because in other studies (Pottasch & Beintema 1999;Bernard Salas et al. 2001, chapter 2) it usually gives a lower T e . Probably this is due to theatomic parameter data. <strong>The</strong> T e derived from the S III using the line ratio 631.2 nm/33 479nm is not included because the errors are too large. Instead the ratio 631.2/18 700 has beenused. It should also be noticed that the S III ratio is sensitive to the adopted N e and this couldexplain the difference found in both T e . To derive chemical abundances T e corresponding tothe IP of each ion (given by the curve in Fig. 3.2) and N e =4500 cm −3 have been assumed.3.5.2 Discussion<strong>The</strong> N e seems to be constant and this could mean that the ejection of the outer layers is nowat lower rates than it has been before, leading to an homogeneous stratification of the nebula.A trend of T e with IP is found. As previously discussed by Bernard Salas et al. (2001,chapter 2) for NGC 7027, this agrees with a simple picture of a nebula where the highionization states are reached closer to the central star so they give higher temperatures, andthe low states of ionization give lower T e because they are formed further away. It is worthmention that the different values for the optical lines (of N II) given by Hyung & Aller (1998)


