

thesis - IRS, The Infrared Spectrograph
thesis - IRS, The Infrared Spectrograph
thesis - IRS, The Infrared Spectrograph

Create successful ePaper yourself
Turn your PDF publications into a flip-book with our unique Google optimized e-Paper software.
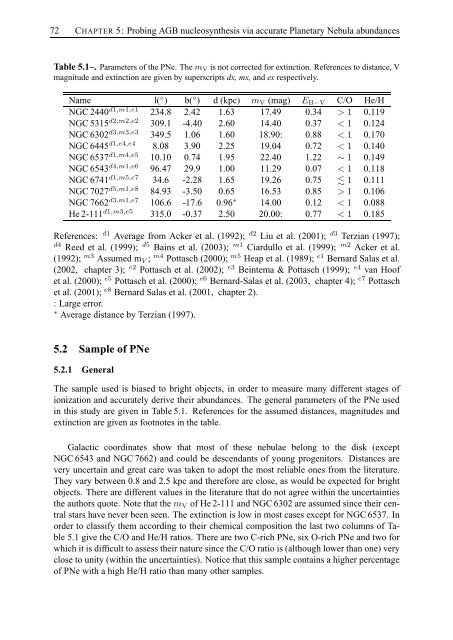
72 CHAPTER 5: Probing AGB nucleosyn<strong>thesis</strong> via accurate Planetary Nebula abundancesTable 5.1–. Parameters of the PNe. <strong>The</strong> m V is not corrected for extinction. References to distance, Vmagnitude and extinction are given by superscripts dx, mx, and ex respectively.Name l( ◦ ) b( ◦ ) d (kpc) m V (mag) E B−V C/O He/HNGC 2440 d1,m1,e1 234.8 2.42 1.63 17.49 0.34 > 1 0.119NGC 5315 d2,m2,e2 309.1 -4.40 2.60 14.40 0.37 < 1 0.124NGC 6302 d3,m3,e3 349.5 1.06 1.60 18.90: 0.88 < 1 0.170NGC 6445 d1,e4,e4 8.08 3.90 2.25 19.04 0.72 < 1 0.140NGC 6537 d1,m4,e5 10.10 0.74 1.95 22.40 1.22 ∼ 1 0.149NGC 6543 d4,m1,e6 96.47 29.9 1.00 11.29 0.07 < 1 0.118NGC 6741 d1,m5,e7 34.6 -2.28 1.65 19.26 0.75 1 0.111NGC 7027 d5,m1,e8 84.93 -3.50 0.65 16.53 0.85 > 1 0.106NGC 7662 d3,m1,e7 106.6 -17.6 0.96 ∗ 14.00 0.12 < 1 0.088He 2-111 d1,m3,e5 315.0 -0.37 2.50 20.00: 0.77 < 1 0.185References: d1 Average from Acker et al. (1992); d2 Liu et al. (2001); d3 Terzian (1997);d4 Reed et al. (1999); d5 Bains et al. (2003); m1 Ciardullo et al. (1999); m2 Acker et al.(1992); m3 Assumed m V ; m4 Pottasch (2000); m5 Heap et al. (1989); e1 Bernard Salas et al.(2002, chapter 3); e2 Pottasch et al. (2002); e3 Beintema & Pottasch (1999); e4 van Hoofet al. (2000); e5 Pottasch et al. (2000); e6 Bernard-Salas et al. (2003, chapter 4); e7 Pottaschet al. (2001); e8 Bernard Salas et al. (2001, chapter 2).: Large error.∗ Average distance by Terzian (1997).5.2 Sample of PNe5.2.1 General<strong>The</strong> sample used is biased to bright objects, in order to measure many different stages ofionization and accurately derive their abundances. <strong>The</strong> general parameters of the PNe usedin this study are given in Table 5.1. References for the assumed distances, magnitudes andextinction are given as footnotes in the table.Galactic coordinates show that most of these nebulae belong to the disk (exceptNGC 6543 and NGC 7662) and could be descendants of young progenitors. Distances arevery uncertain and great care was taken to adopt the most reliable ones from the literature.<strong>The</strong>y vary between 0.8 and 2.5 kpc and therefore are close, as would be expected for brightobjects. <strong>The</strong>re are different values in the literature that do not agree within the uncertaintiesthe authors quote. Note that the m V of He 2-111 and NGC 6302 are assumed since their centralstars have never been seen. <strong>The</strong> extinction is low in most cases except for NGC 6537. Inorder to classify them according to their chemical composition the last two columns of Table5.1 give the C/O and He/H ratios. <strong>The</strong>re are two C-rich PNe, six O-rich PNe and two forwhich it is difficult to assess their nature since the C/O ratio is (although lower than one) veryclose to unity (within the uncertainties). Notice that this sample contains a higher percentageof PNe with a high He/H ratio than many other samples.


