

thesis - IRS, The Infrared Spectrograph
thesis - IRS, The Infrared Spectrograph
thesis - IRS, The Infrared Spectrograph

You also want an ePaper? Increase the reach of your titles
YUMPU automatically turns print PDFs into web optimized ePapers that Google loves.
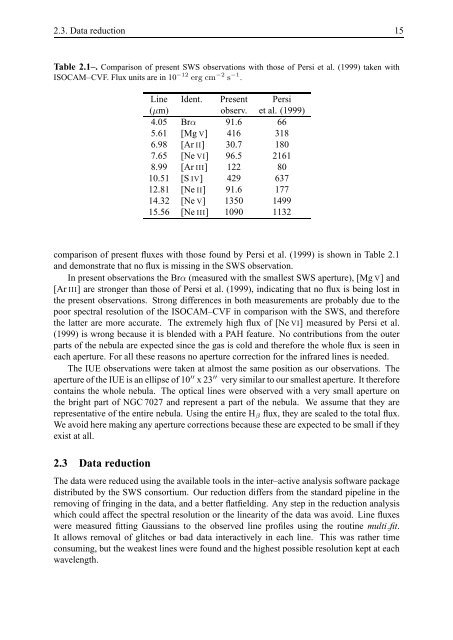
2.3. Data reduction 15Table 2.1–. Comparison of present SWS observations with those of Persi et al. (1999) taken withISOCAM–CVF. Flux units are in 10 −12 erg cm −2 s −1 .Line Ident. Present Persi(µm) observ. et al. (1999)4.05 Brα 91.6 665.61 [Mg V] 416 3186.98 [Ar II] 30.7 1807.65 [Ne VI] 96.5 21618.99 [Ar III] 122 8010.51 [S IV] 429 63712.81 [Ne II] 91.6 17714.32 [Ne V] 1350 149915.56 [Ne III] 1090 1132comparison of present fluxes with those found by Persi et al. (1999) is shown in Table 2.1and demonstrate that no flux is missing in the SWS observation.In present observations the Brα (measured with the smallest SWS aperture), [Mg V] and[Ar III] are stronger than those of Persi et al. (1999), indicating that no flux is being lost inthe present observations. Strong differences in both measurements are probably due to thepoor spectral resolution of the ISOCAM–CVF in comparison with the SWS, and thereforethe latter are more accurate. <strong>The</strong> extremely high flux of [Ne VI] measured by Persi et al.(1999) is wrong because it is blended with a PAH feature. No contributions from the outerparts of the nebula are expected since the gas is cold and therefore the whole flux is seen ineach aperture. For all these reasons no aperture correction for the infrared lines is needed.<strong>The</strong> IUE observations were taken at almost the same position as our observations. <strong>The</strong>aperture of the IUE is an ellipse of 10 ′′ x 23 ′′ very similar to our smallest aperture. It thereforecontains the whole nebula. <strong>The</strong> optical lines were observed with a very small aperture onthe bright part of NGC 7027 and represent a part of the nebula. We assume that they arerepresentative of the entire nebula. Using the entire H β flux, they are scaled to the total flux.We avoid here making any aperture corrections because these are expected to be small if theyexist at all.2.3 Data reduction<strong>The</strong> data were reduced using the available tools in the inter–active analysis software packagedistributed by the SWS consortium. Our reduction differs from the standard pipeline in theremoving of fringing in the data, and a better flatfielding. Any step in the reduction analysiswhich could affect the spectral resolution or the linearity of the data was avoid. Line fluxeswere measured fitting Gaussians to the observed line profiles using the routine multi fit.It allows removal of glitches or bad data interactively in each line. This was rather timeconsuming, but the weakest lines were found and the highest possible resolution kept at eachwavelength.


