

thesis - IRS, The Infrared Spectrograph
thesis - IRS, The Infrared Spectrograph
thesis - IRS, The Infrared Spectrograph

You also want an ePaper? Increase the reach of your titles
YUMPU automatically turns print PDFs into web optimized ePapers that Google loves.
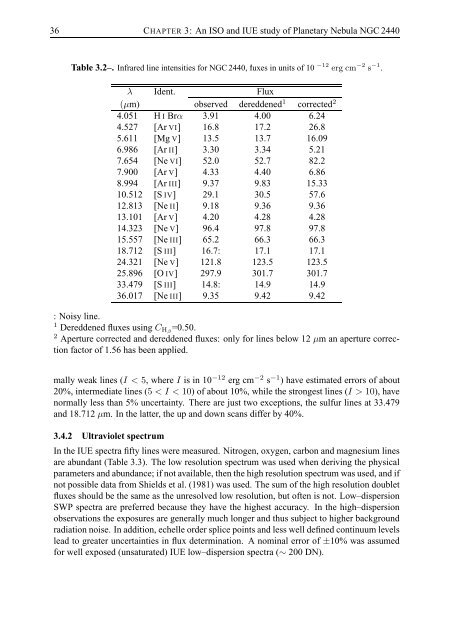
36 CHAPTER 3: An ISO and IUE study of Planetary Nebula NGC 2440Table 3.2–. <strong>Infrared</strong> line intensities for NGC 2440, fluxes in units of 10 −12 erg cm −2 s −1 .λ Ident. Flux(µm) observed dereddened 1 corrected 24.051 H I Brα 3.91 4.00 6.244.527 [Ar VI] 16.8 17.2 26.85.611 [Mg V] 13.5 13.7 16.096.986 [Ar II] 3.30 3.34 5.217.654 [Ne VI] 52.0 52.7 82.27.900 [Ar V] 4.33 4.40 6.868.994 [Ar III] 9.37 9.83 15.3310.512 [S IV] 29.1 30.5 57.612.813 [Ne II] 9.18 9.36 9.3613.101 [Ar V] 4.20 4.28 4.2814.323 [Ne V] 96.4 97.8 97.815.557 [Ne III] 65.2 66.3 66.318.712 [S III] 16.7: 17.1 17.124.321 [Ne V] 121.8 123.5 123.525.896 [O IV] 297.9 301.7 301.733.479 [S III] 14.8: 14.9 14.936.017 [Ne III] 9.35 9.42 9.42: Noisy line.1 Dereddened fluxes using C Hβ =0.50.2 Aperture corrected and dereddened fluxes: only for lines below 12 µm an aperture correctionfactor of 1.56 has been applied.mally weak lines (I < 5, where I is in 10 −12 erg cm −2 s −1 ) have estimated errors of about20%, intermediate lines (5 < I < 10) of about 10%, while the strongest lines (I > 10), havenormally less than 5% uncertainty. <strong>The</strong>re are just two exceptions, the sulfur lines at 33.479and 18.712 µm. In the latter, the up and down scans differ by 40%.3.4.2 Ultraviolet spectrumIn the IUE spectra fifty lines were measured. Nitrogen, oxygen, carbon and magnesium linesare abundant (Table 3.3). <strong>The</strong> low resolution spectrum was used when deriving the physicalparameters and abundance; if not available, then the high resolution spectrum was used, and ifnot possible data from Shields et al. (1981) was used. <strong>The</strong> sum of the high resolution doubletfluxes should be the same as the unresolved low resolution, but often is not. Low–dispersionSWP spectra are preferred because they have the highest accuracy. In the high–dispersionobservations the exposures are generally much longer and thus subject to higher backgroundradiation noise. In addition, echelle order splice points and less well defined continuum levelslead to greater uncertainties in flux determination. A nominal error of ±10% was assumedfor well exposed (unsaturated) IUE low–dispersion spectra (∼ 200 DN).


