thesis - IRS, The Infrared Spectrograph
thesis - IRS, The Infrared Spectrograph
thesis - IRS, The Infrared Spectrograph
You also want an ePaper? Increase the reach of your titles
YUMPU automatically turns print PDFs into web optimized ePapers that Google loves.
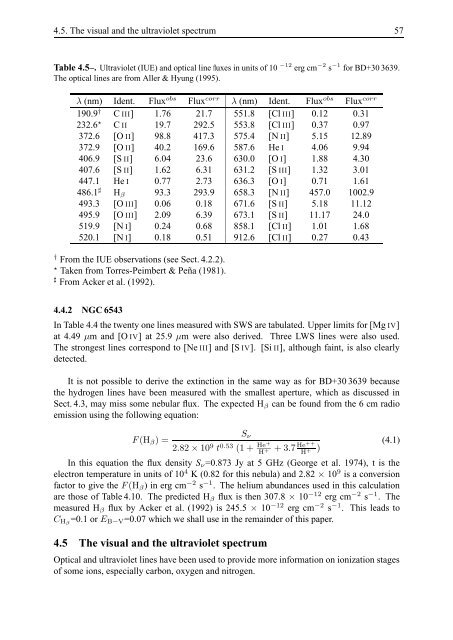
4.5. <strong>The</strong> visual and the ultraviolet spectrum 57Table 4.5–. Ultraviolet (IUE) and optical line fluxes in units of 10 −12 erg cm −2 s −1 for BD+30 3639.<strong>The</strong> optical lines are from Aller & Hyung (1995).λ (nm) Ident. Flux obs Flux corr λ (nm) Ident. Flux obs Flux corr190.9 † C III] 1.76 21.7 551.8 [Cl III] 0.12 0.31232.6 ⋆ C II 19.7 292.5 553.8 [Cl III] 0.37 0.97372.6 [O II] 98.8 417.3 575.4 [N II] 5.15 12.89372.9 [O II] 40.2 169.6 587.6 He I 4.06 9.94406.9 [S II] 6.04 23.6 630.0 [O I] 1.88 4.30407.6 [S II] 1.62 6.31 631.2 [S III] 1.32 3.01447.1 He I 0.77 2.73 636.3 [O I] 0.71 1.61486.1 ♯ H β 93.3 293.9 658.3 [N II] 457.0 1002.9493.3 [O III] 0.06 0.18 671.6 [S II] 5.18 11.12495.9 [O III] 2.09 6.39 673.1 [S II] 11.17 24.0519.9 [N I] 0.24 0.68 858.1 [Cl II] 1.01 1.68520.1 [N I] 0.18 0.51 912.6 [Cl II] 0.27 0.43† From the IUE observations (see Sect. 4.2.2).⋆ Taken from Torres-Peimbert & Peña (1981).♯ From Acker et al. (1992).4.4.2 NGC 6543In Table 4.4 the twenty one lines measured with SWS are tabulated. Upper limits for [Mg IV]at 4.49 µm and [O IV] at 25.9 µm were also derived. Three LWS lines were also used.<strong>The</strong> strongest lines correspond to [Ne III] and [S IV]. [Si II], although faint, is also clearlydetected.It is not possible to derive the extinction in the same way as for BD+30 3639 becausethe hydrogen lines have been measured with the smallest aperture, which as discussed inSect. 4.3, may miss some nebular flux. <strong>The</strong> expected H β can be found from the 6 cm radioemission using the following equation:F (H β ) =(4.1)2.82 × 10 9 t 0.53 (1 + He+H+ 3.7 He+++ H) +In this equation the flux density S ν =0.873 Jy at 5 GHz (George et al. 1974), t is theelectron temperature in units of 10 4 K (0.82 for this nebula) and 2.82 × 10 9 is a conversionfactor to give the F (H β ) in erg cm −2 s −1 . <strong>The</strong> helium abundances used in this calculationare those of Table 4.10. <strong>The</strong> predicted H β flux is then 307.8 × 10 −12 erg cm −2 s −1 . <strong>The</strong>measured H β flux by Acker et al. (1992) is 245.5 × 10 −12 erg cm −2 s −1 . This leads toC Hβ =0.1 or E B−V =0.07 which we shall use in the remainder of this paper.4.5 <strong>The</strong> visual and the ultraviolet spectrumOptical and ultraviolet lines have been used to provide more information on ionization stagesof some ions, especially carbon, oxygen and nitrogen.S ν


