CHAPTER 9off. In 2010, c<strong>on</strong>victi<strong>on</strong> rate was 40.7% whichdecreased marg<strong>in</strong>ally as compared to 41.7%<strong>in</strong> 2009. Low c<strong>on</strong>victi<strong>on</strong> rate is an <strong>in</strong>dicator of<strong>in</strong>adequacies <strong>in</strong> the Crim<strong>in</strong>al Justice System <strong>in</strong>general and <strong>in</strong>vestigati<strong>on</strong> and prosecuti<strong>on</strong> <strong>in</strong>particular. In order to w<strong>in</strong> the faith of citizens<strong>in</strong> the crim<strong>in</strong>al justice system, all its w<strong>in</strong>gsshould c<strong>on</strong>tribute their efforts to improve thec<strong>on</strong>victi<strong>on</strong> rate. Highest c<strong>on</strong>victi<strong>on</strong> rate was,however, seen <strong>in</strong> the state of Mizoram dur<strong>in</strong>g2010, which recorded 93.6% c<strong>on</strong>victi<strong>on</strong> ratefollowed by 78.5% <strong>in</strong> Nagaland and 74.3% <strong>in</strong>Sikkim.Disposal of cases under Special andLocal Laws (SLL) by CourtsAt All <strong>India</strong> level there were a total of93,14,925 SLL cases, <strong>in</strong>clud<strong>in</strong>g those broughtforward from the previous year, due for disposalby the Crim<strong>in</strong>al Courts dur<strong>in</strong>g 2010. The stateof Uttar Pradesh has reported the maximumof 36,42,192 cases under SLL category pend<strong>in</strong>gfor trial, followed by 15,16359 <strong>in</strong> Gujarat and12,78,542 <strong>in</strong> Maharashtra.The All <strong>India</strong> average pendency ofSLL cases <strong>in</strong> courts i.e. net pendencyafter disposal dur<strong>in</strong>g the year was at 52.1percent. The pendency of SLL cases bycourts am<strong>on</strong>g states was reported to be thehighest (100.0%) <strong>in</strong> Lakshadweep. The next<strong>in</strong> order was Manipur (98.8%), followedby Arunachal Pradesh (97.6%). Details aregiven <strong>in</strong> Table – 9.5. (Page No. 119)The c<strong>on</strong>victi<strong>on</strong> rate for SLL crimeswas much higher (91.7%) than that of IPCcrimes (40.7%) at the nati<strong>on</strong>al level. Thehighest c<strong>on</strong>victi<strong>on</strong> rate <strong>in</strong> SLL crimes am<strong>on</strong>gstates was reported by D N Haveli (100%)followed by Uttrakhand (99.8%) and A &N Island (99.7%).Exhibits await<strong>in</strong>g exam<strong>in</strong>ati<strong>on</strong> <strong>in</strong> theState and Regi<strong>on</strong>al FSLsThere were a total of 18,37,318 exhibits,<strong>in</strong>clud<strong>in</strong>g those carried forward from theprevious year pend<strong>in</strong>g for exam<strong>in</strong>ati<strong>on</strong><strong>in</strong> various Forensic Science Laboratories(FSLs) <strong>in</strong> the country dur<strong>in</strong>g 2010. Out ofthese <strong>in</strong> 12,75,404 exhibits exam<strong>in</strong>ati<strong>on</strong>was <strong>in</strong>itiated and these were disposed off,account<strong>in</strong>g for 69.1% of the total exhibitsawait<strong>in</strong>g exam<strong>in</strong>ati<strong>on</strong>. As many as 5,61,914(30.6%) exhibits rema<strong>in</strong>ed pend<strong>in</strong>g fordisposal as <strong>on</strong> 1.1.2011.At state level the highest number of3,47,711 exhibits were disposed of dur<strong>in</strong>gthe year 2010 <strong>in</strong> Punjab, followed by2,19,955 <strong>in</strong> Tamil Nadu and 2,09,253 <strong>in</strong>Gujarat. Punjab State has reported highestnumber 1,76,847 of exhibits pend<strong>in</strong>gexam<strong>in</strong>ati<strong>on</strong> as <strong>on</strong> 1.1.2011. The next <strong>in</strong>the order was Tamil Nadu 76,752 followedby Orissa 53,304. Details are given <strong>in</strong> Table– 9.6. (Page No. 120)Slow disposal of exhibits has a whiplasheffect <strong>on</strong> the entire cha<strong>in</strong> of <strong>in</strong>vestigati<strong>on</strong>,trial and c<strong>on</strong>victi<strong>on</strong> of crim<strong>in</strong>al cases. It alsohampers and slows down the <strong>in</strong>vestigati<strong>on</strong>process. Increas<strong>in</strong>g the capacity <strong>in</strong> ourForensic Science Laboratories (FSL) iscalled for urgently. Automati<strong>on</strong> of Test<strong>in</strong>gMach<strong>in</strong>es and recruitment of experts <strong>in</strong>adequate numbers for test<strong>in</strong>g labs (FSLs) isalso likely to help and solve this problemsignificantly which is be<strong>in</strong>g attemptedunder the Modernizati<strong>on</strong> of <strong>Police</strong> ForcesScheme (MPF Scheme) launched by theCentral Governments jo<strong>in</strong>tly with the StateGovernments with effect from the f<strong>in</strong>ancialyear 2000-01.110
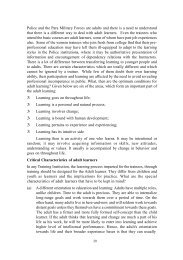
CHAPTER 9Sl.No.TABLE 9.1 -- NUMBER OF DEPARTMENTAL PROCEEDINGS INITIATED AND DISPOSED OFFAGAINST POLICE PERSONNEL DURING 2010States / UTs. Pend<strong>in</strong>g as <strong>on</strong>1.1.2010Initiated <strong>in</strong>2010Total Number ofProceed<strong>in</strong>gs <strong>in</strong>2010Disposed Off<strong>in</strong> 2010(BothCurrent & Old)Pend<strong>in</strong>g as<strong>on</strong> 1.1.2011(1) (2) (3) (4) (5) (6) (7)1 Andhra Pradesh 2,993 3,214 6,207 3,636 2,5712 Arunachal Pradesh 106 105 211 105 1063 Assam 716 387 1,103 456 6474 Bihar NA NA NA NA NA5 Chhattisgarh 243 325 568 219 3496 Goa 43 54 97 34 637 Gujarat 2,142 1,294 3,436 1,358 2,0788 Haryana 1,151 842 1,993 864 1,1299 Himachal Pradesh 66 128 194 127 6710 Jammu & Kashmir 702 3,212 3,914 2,964 95011 Jharkhand 2,337 2,553 4,890 3,091 1,79912 Karnataka 647 461 1,108 410 69813 Kerala 1,622 787 2,409 682 1,72714 Madhya Pradesh 1,406 1,683 3,089 1,809 1,28015 Maharashtra 711 704 1,415 726 68916 Manipur 288 141 429 231 19817 Meghalaya 43 32 75 47 2818 Mizoram 55 190 245 171 7419 Nagaland 17 22 39 19 2020 Orissa 2,160 754 2,914 1,034 1,88021 Punjab 4 0 4 0 422 Rajasthan 1,024 3,699 4,723 3,797 92623 Sikkim 15 26 41 26 1524 Tamil Nadu 2,061 4,413 6,474 4,327 2,14725 Tripura 52 65 117 52 6526 Uttar Pradesh 2,440 12,305 14,745 12,114 2,63127 Uttarakhand 137 298 435 289 14628 West Bengal 857 908 1,765 862 90329 A&N Islands 27 14 41 20 2130 Chandigarh 107 44 151 32 11931 D&N Haveli 6 0 6 0 632 Daman & Diu 9 0 9 0 933 Delhi 1,472 991 2,463 558 1,90534 Lakshadweep 3 0 3 0 335 Puducherry 54 16 70 22 48All <strong>India</strong> 25,716 39,667 65,383 40,082 25,301NA: Not Available111