Data on Police Organisations in India - Commonwealth Human ...
Data on Police Organisations in India - Commonwealth Human ...
Data on Police Organisations in India - Commonwealth Human ...
Create successful ePaper yourself
Turn your PDF publications into a flip-book with our unique Google optimized e-Paper software.
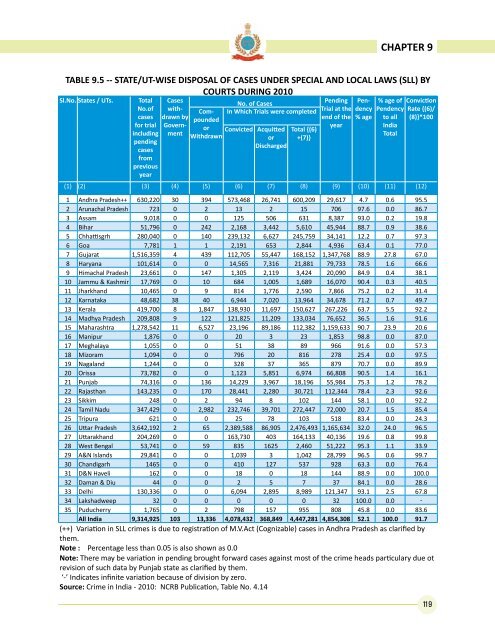
CHAPTER 9TABLE 9.5 -- STATE/UT-WISE DISPOSAL OF CASES UNDER SPECIAL AND LOCAL LAWS (SLL) BYCOURTS DURING 2010Sl.No. States / UTs.TotalNo.ofcasesfor trial<strong>in</strong>clud<strong>in</strong>gpend<strong>in</strong>gcasesfrompreviousyearCompoundedorWithdrawnNo. of CasesIn Which Trials were completedC<strong>on</strong>victed AcquittedorDischargedTotal {(6)+(7)}Pend<strong>in</strong>gTrial at theend of theyearCaseswithdrawnbyGovernmentPendency% age% age ofPendencyto all<strong>India</strong>TotalC<strong>on</strong>victi<strong>on</strong>Rate {(6)/(8)}*100(1) (2) (3) (4) (5) (6) (7) (8) (9) (10) (11) (12)1 Andhra Pradesh++ 630,220 30 394 573,468 26,741 600,209 29,617 4.7 0.6 95.52 Arunachal Pradesh 723 0 2 13 2 15 706 97.6 0.0 86.73 Assam 9,018 0 0 125 506 631 8,387 93.0 0.2 19.84 Bihar 51,796 0 242 2,168 3,442 5,610 45,944 88.7 0.9 38.65 Chhattisgrh 280,040 0 140 239,132 6,627 245,759 34,141 12.2 0.7 97.36 Goa 7,781 1 1 2,191 653 2,844 4,936 63.4 0.1 77.07 Gujarat 1,516,359 4 439 112,705 55,447 168,152 1,347,768 88.9 27.8 67.08 Haryana 101,614 0 0 14,565 7,316 21,881 79,733 78.5 1.6 66.69 Himachal Pradesh 23,661 0 147 1,305 2,119 3,424 20,090 84.9 0.4 38.110 Jammu & Kashmir 17,769 0 10 684 1,005 1,689 16,070 90.4 0.3 40.511 Jharkhand 10,465 0 9 814 1,776 2,590 7,866 75.2 0.2 31.412 Karnataka 48,682 38 40 6,944 7,020 13,964 34,678 71.2 0.7 49.713 Kerala 419,700 8 1,847 138,930 11,697 150,627 267,226 63.7 5.5 92.214 Madhya Pradesh 209,808 9 122 121,825 11,209 133,034 76,652 36.5 1.6 91.615 Maharashtra 1,278,542 11 6,527 23,196 89,186 112,382 1,159,633 90.7 23.9 20.616 Manipur 1,876 0 0 20 3 23 1,853 98.8 0.0 87.017 Meghalaya 1,055 0 0 51 38 89 966 91.6 0.0 57.318 Mizoram 1,094 0 0 796 20 816 278 25.4 0.0 97.519 Nagaland 1,244 0 0 328 37 365 879 70.7 0.0 89.920 Orissa 73,782 0 0 1,123 5,851 6,974 66,808 90.5 1.4 16.121 Punjab 74,316 0 136 14,229 3,967 18,196 55,984 75.3 1.2 78.222 Rajasthan 143,235 0 170 28,441 2,280 30,721 112,344 78.4 2.3 92.623 Sikkim 248 0 2 94 8 102 144 58.1 0.0 92.224 Tamil Nadu 347,429 0 2,982 232,746 39,701 272,447 72,000 20.7 1.5 85.425 Tripura 621 0 0 25 78 103 518 83.4 0.0 24.326 Uttar Pradesh 3,642,192 2 65 2,389,588 86,905 2,476,493 1,165,634 32.0 24.0 96.527 Uttarakhand 204,269 0 0 163,730 403 164,133 40,136 19.6 0.8 99.828 West Bengal 53,741 0 59 835 1625 2,460 51,222 95.3 1.1 33.929 A&N Islands 29,841 0 0 1,039 3 1,042 28,799 96.5 0.6 99.730 Chandigarh 1465 0 0 410 127 537 928 63.3 0.0 76.431 D&N Haveli 162 0 0 18 0 18 144 88.9 0.0 100.032 Daman & Diu 44 0 0 2 5 7 37 84.1 0.0 28.633 Delhi 130,336 0 0 6,094 2,895 8,989 121,347 93.1 2.5 67.834 Lakshadweep 32 0 0 0 0 0 32 100.0 0.0 -35 Puducherry 1,765 0 2 798 157 955 808 45.8 0.0 83.6All <strong>India</strong> 9,314,925 103 13,336 4,078,432 368,849 4,447,281 4,854,308 52.1 100.0 91.7(++) Variati<strong>on</strong> <strong>in</strong> SLL crimes is due to registrati<strong>on</strong> of M.V.Act (Cognizable) cases <strong>in</strong> Andhra Pradesh as clarified bythem.Note : Percentage less than 0.05 is also shown as 0.0Note: There may be variati<strong>on</strong> <strong>in</strong> pend<strong>in</strong>g brought forward cases aga<strong>in</strong>st most of the crime heads particulary due otrevisi<strong>on</strong> of such data by Punjab state as clarified by them.‘-’ Indicates <strong>in</strong>f<strong>in</strong>ite variati<strong>on</strong> because of divisi<strong>on</strong> by zero.Source: Crime <strong>in</strong> <strong>India</strong> - 2010: NCRB Publicati<strong>on</strong>, Table No. 4.1411 9


