Data on Police Organisations in India - Commonwealth Human ...
Data on Police Organisations in India - Commonwealth Human ...
Data on Police Organisations in India - Commonwealth Human ...

Create successful ePaper yourself
Turn your PDF publications into a flip-book with our unique Google optimized e-Paper software.
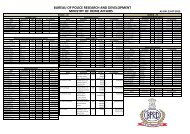
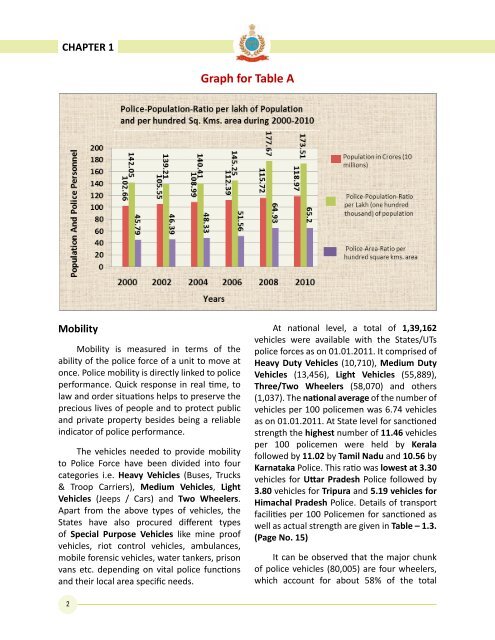
CHAPTER 1Graph for Table AMobilityMobility is measured <strong>in</strong> terms of theability of the police force of a unit to move at<strong>on</strong>ce. <strong>Police</strong> mobility is directly l<strong>in</strong>ked to policeperformance. Quick resp<strong>on</strong>se <strong>in</strong> real time, tolaw and order situati<strong>on</strong>s helps to preserve theprecious lives of people and to protect publicand private property besides be<strong>in</strong>g a reliable<strong>in</strong>dicator of police performance.The vehicles needed to provide mobilityto <strong>Police</strong> Force have been divided <strong>in</strong>to fourcategories i.e. Heavy Vehicles (Buses, Trucks& Troop Carriers), Medium Vehicles, LightVehicles (Jeeps / Cars) and Two Wheelers.Apart from the above types of vehicles, theStates have also procured different typesof Special Purpose Vehicles like m<strong>in</strong>e proofvehicles, riot c<strong>on</strong>trol vehicles, ambulances,mobile forensic vehicles, water tankers, pris<strong>on</strong>vans etc. depend<strong>in</strong>g <strong>on</strong> vital police functi<strong>on</strong>sand their local area specific needs.At nati<strong>on</strong>al level, a total of 1,39,162vehicles were available with the States/UTspolice forces as <strong>on</strong> 01.01.2011. It comprised ofHeavy Duty Vehicles (10,710), Medium DutyVehicles (13,456), Light Vehicles (55,889),Three/Two Wheelers (58,070) and others(1,037). The nati<strong>on</strong>al average of the number ofvehicles per 100 policemen was 6.74 vehiclesas <strong>on</strong> 01.01.2011. At State level for sancti<strong>on</strong>edstrength the highest number of 11.46 vehiclesper 100 policemen were held by Keralafollowed by 11.02 by Tamil Nadu and 10.56 byKarnataka <strong>Police</strong>. This ratio was lowest at 3.30vehicles for Uttar Pradesh <strong>Police</strong> followed by3.80 vehicles for Tripura and 5.19 vehicles forHimachal Pradesh <strong>Police</strong>. Details of transportfacilities per 100 <strong>Police</strong>men for sancti<strong>on</strong>ed aswell as actual strength are given <strong>in</strong> Table – 1.3.(Page No. 15)It can be observed that the major chunkof police vehicles (80,005) are four wheelers,which account for about 58% of the total2