Data on Police Organisations in India - Commonwealth Human ...
Data on Police Organisations in India - Commonwealth Human ...
Data on Police Organisations in India - Commonwealth Human ...

You also want an ePaper? Increase the reach of your titles
YUMPU automatically turns print PDFs into web optimized ePapers that Google loves.
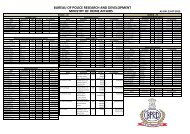
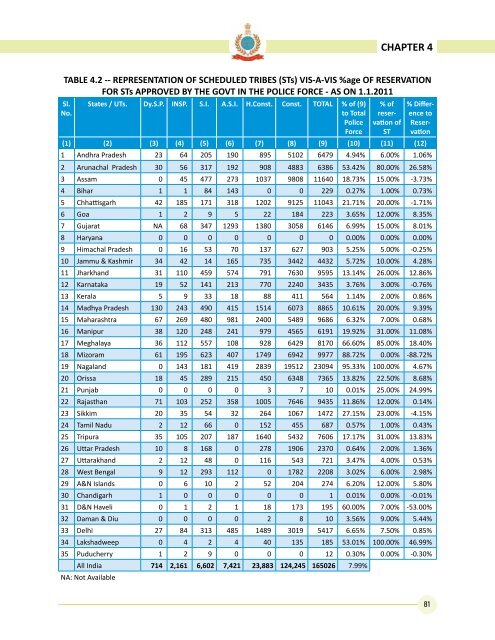
CHAPTER 4TABLE 4.2 -- REPRESENTATION OF SCHEDULED TRIBES (STs) VIS-A-VIS %age OF RESERVATIONFOR STs APPROVED BY THE GOVT IN THE POLICE FORCE - AS ON 1.1.2011Sl.No.States / UTs. Dy.S.P. INSP. S.I. A.S.I. H.C<strong>on</strong>st. C<strong>on</strong>st. TOTAL % of (9)to Total<strong>Police</strong>Force% ofreservati<strong>on</strong>ofST% DifferencetoReservati<strong>on</strong>(1) (2) (3) (4) (5) (6) (7) (8) (9) (10) (11) (12)1 Andhra Pradesh 23 64 205 190 895 5102 6479 4.94% 6.00% 1.06%2 Arunachal Pradesh 30 56 317 192 908 4883 6386 53.42% 80.00% 26.58%3 Assam 0 45 477 273 1037 9808 11640 18.73% 15.00% -3.73%4 Bihar 1 1 84 143 0 0 229 0.27% 1.00% 0.73%5 Chhattisgarh 42 185 171 318 1202 9125 11043 21.71% 20.00% -1.71%6 Goa 1 2 9 5 22 184 223 3.65% 12.00% 8.35%7 Gujarat NA 68 347 1293 1380 3058 6146 6.99% 15.00% 8.01%8 Haryana 0 0 0 0 0 0 0 0.00% 0.00% 0.00%9 Himachal Pradesh 0 16 53 70 137 627 903 5.25% 5.00% -0.25%10 Jammu & Kashmir 34 42 14 165 735 3442 4432 5.72% 10.00% 4.28%11 Jharkhand 31 110 459 574 791 7630 9595 13.14% 26.00% 12.86%12 Karnataka 19 52 141 213 770 2240 3435 3.76% 3.00% -0.76%13 Kerala 5 9 33 18 88 411 564 1.14% 2.00% 0.86%14 Madhya Pradesh 130 243 490 415 1514 6073 8865 10.61% 20.00% 9.39%15 Maharashtra 67 269 480 981 2400 5489 9686 6.32% 7.00% 0.68%16 Manipur 38 120 248 241 979 4565 6191 19.92% 31.00% 11.08%17 Meghalaya 36 112 557 108 928 6429 8170 66.60% 85.00% 18.40%18 Mizoram 61 195 623 407 1749 6942 9977 88.72% 0.00% -88.72%19 Nagaland 0 143 181 419 2839 19512 23094 95.33% 100.00% 4.67%20 Orissa 18 45 289 215 450 6348 7365 13.82% 22.50% 8.68%21 Punjab 0 0 0 0 3 7 10 0.01% 25.00% 24.99%22 Rajasthan 71 103 252 358 1005 7646 9435 11.86% 12.00% 0.14%23 Sikkim 20 35 54 32 264 1067 1472 27.15% 23.00% -4.15%24 Tamil Nadu 2 12 66 0 152 455 687 0.57% 1.00% 0.43%25 Tripura 35 105 207 187 1640 5432 7606 17.17% 31.00% 13.83%26 Uttar Pradesh 10 8 168 0 278 1906 2370 0.64% 2.00% 1.36%27 Uttarakhand 2 12 48 0 116 543 721 3.47% 4.00% 0.53%28 West Bengal 9 12 293 112 0 1782 2208 3.02% 6.00% 2.98%29 A&N Islands 0 6 10 2 52 204 274 6.20% 12.00% 5.80%30 Chandigarh 1 0 0 0 0 0 1 0.01% 0.00% -0.01%31 D&N Haveli 0 1 2 1 18 173 195 60.00% 7.00% -53.00%32 Daman & Diu 0 0 0 0 2 8 10 3.56% 9.00% 5.44%33 Delhi 27 84 313 485 1489 3019 5417 6.65% 7.50% 0.85%34 Lakshadweep 0 4 2 4 40 135 185 53.01% 100.00% 46.99%35 Puducherry 1 2 9 0 0 0 12 0.30% 0.00% -0.30%All <strong>India</strong> 714 2,161 6,602 7,421 23,883 124,245 165026 7.99%NA: Not Available81