Data on Police Organisations in India - Commonwealth Human ...
Data on Police Organisations in India - Commonwealth Human ...
Data on Police Organisations in India - Commonwealth Human ...
You also want an ePaper? Increase the reach of your titles
YUMPU automatically turns print PDFs into web optimized ePapers that Google loves.
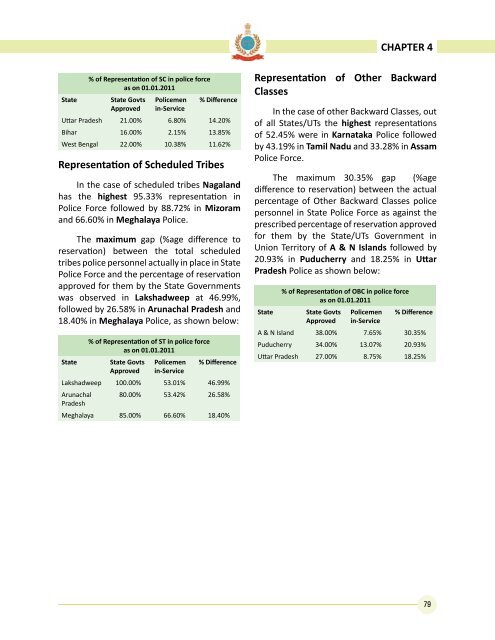
CHAPTER 4State% of Representati<strong>on</strong> of SC <strong>in</strong> police forceas <strong>on</strong> 01.01.2011State GovtsApproved<strong>Police</strong>men<strong>in</strong>-Service% DifferenceUttar Pradesh 21.00% 6.80% 14.20%Bihar 16.00% 2.15% 13.85%West Bengal 22.00% 10.38% 11.62%Representati<strong>on</strong> of Scheduled TribesIn the case of scheduled tribes Nagalandhas the highest 95.33% representati<strong>on</strong> <strong>in</strong><strong>Police</strong> Force followed by 88.72% <strong>in</strong> Mizoramand 66.60% <strong>in</strong> Meghalaya <strong>Police</strong>.The maximum gap (%age difference toreservati<strong>on</strong>) between the total scheduledtribes police pers<strong>on</strong>nel actually <strong>in</strong> place <strong>in</strong> State<strong>Police</strong> Force and the percentage of reservati<strong>on</strong>approved for them by the State Governmentswas observed <strong>in</strong> Lakshadweep at 46.99%,followed by 26.58% <strong>in</strong> Arunachal Pradesh and18.40% <strong>in</strong> Meghalaya <strong>Police</strong>, as shown below:State% of Representati<strong>on</strong> of ST <strong>in</strong> police forceas <strong>on</strong> 01.01.2011State GovtsApproved<strong>Police</strong>men<strong>in</strong>-Service% DifferenceLakshadweep 100.00% 53.01% 46.99%Arunachal 80.00% 53.42% 26.58%PradeshMeghalaya 85.00% 66.60% 18.40%Representati<strong>on</strong> of Other BackwardClassesIn the case of other Backward Classes, outof all States/UTs the highest representati<strong>on</strong>sof 52.45% were <strong>in</strong> Karnataka <strong>Police</strong> followedby 43.19% <strong>in</strong> Tamil Nadu and 33.28% <strong>in</strong> Assam<strong>Police</strong> Force.The maximum 30.35% gap (%agedifference to reservati<strong>on</strong>) between the actualpercentage of Other Backward Classes policepers<strong>on</strong>nel <strong>in</strong> State <strong>Police</strong> Force as aga<strong>in</strong>st theprescribed percentage of reservati<strong>on</strong> approvedfor them by the State/UTs Government <strong>in</strong>Uni<strong>on</strong> Territory of A & N Islands followed by20.93% <strong>in</strong> Puducherry and 18.25% <strong>in</strong> UttarPradesh <strong>Police</strong> as shown below:State% of Representati<strong>on</strong> of OBC <strong>in</strong> police forceas <strong>on</strong> 01.01.2011State GovtsApproved<strong>Police</strong>men<strong>in</strong>-Service% DifferenceA & N Island 38.00% 7.65% 30.35%Puducherry 34.00% 13.07% 20.93%Uttar Pradesh 27.00% 8.75% 18.25%79


