Data on Police Organisations in India - Commonwealth Human ...
Data on Police Organisations in India - Commonwealth Human ...
Data on Police Organisations in India - Commonwealth Human ...

Create successful ePaper yourself
Turn your PDF publications into a flip-book with our unique Google optimized e-Paper software.
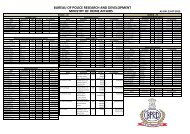
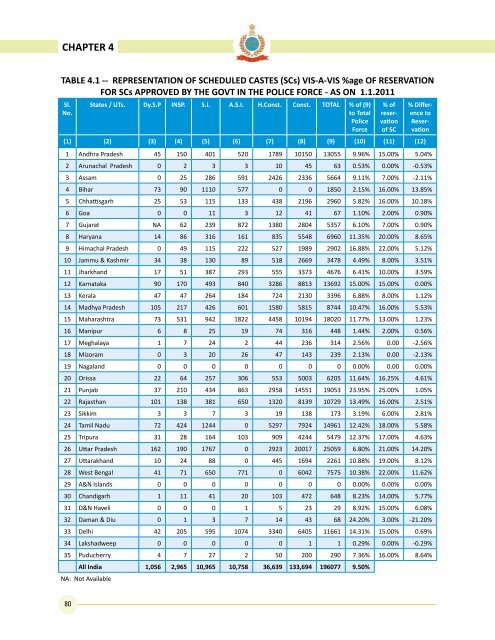
CHAPTER 4TABLE 4.1 -- REPRESENTATION OF SCHEDULED CASTES (SCs) VIS-A-VIS %age OF RESERVATIONFOR SCs APPROVED BY THE GOVT IN THE POLICE FORCE - AS ON 1.1.2011Sl.No.States / UTs. Dy.S.P INSP. S.I. A.S.I. H.C<strong>on</strong>st. C<strong>on</strong>st. TOTAL % of (9)to Total<strong>Police</strong>Force% ofreservati<strong>on</strong>of SC(1) (2) (3) (4) (5) (6) (7) (8) (9) (10) (11) (12)% DifferencetoReservati<strong>on</strong>1 Andhra Pradesh 45 150 401 520 1789 10150 13055 9.96% 15.00% 5.04%2 Arunachal Pradesh 0 2 3 3 10 45 63 0.53% 0.00% -0.53%3 Assam 0 25 286 591 2426 2336 5664 9.11% 7.00% -2.11%4 Bihar 73 90 1110 577 0 0 1850 2.15% 16.00% 13.85%5 Chhattisgarh 25 53 115 133 438 2196 2960 5.82% 16.00% 10.18%6 Goa 0 0 11 3 12 41 67 1.10% 2.00% 0.90%7 Gujarat NA 62 239 872 1380 2804 5357 6.10% 7.00% 0.90%8 Haryana 14 86 316 161 835 5548 6960 11.35% 20.00% 8.65%9 Himachal Pradesh 0 49 115 222 527 1989 2902 16.88% 22.00% 5.12%10 Jammu & Kashmir 34 38 130 89 518 2669 3478 4.49% 8.00% 3.51%11 Jharkhand 17 51 387 293 555 3373 4676 6.41% 10.00% 3.59%12 Karnataka 90 170 493 840 3286 8813 13692 15.00% 15.00% 0.00%13 Kerala 47 47 264 184 724 2130 3396 6.88% 8.00% 1.12%14 Madhya Pradesh 105 217 426 601 1580 5815 8744 10.47% 16.00% 5.53%15 Maharashtra 73 531 942 1822 4458 10194 18020 11.77% 13.00% 1.23%16 Manipur 6 8 25 19 74 316 448 1.44% 2.00% 0.56%17 Meghalaya 1 7 24 2 44 236 314 2.56% 0.00 -2.56%18 Mizoram 0 3 20 26 47 143 239 2.13% 0.00 -2.13%19 Nagaland 0 0 0 0 0 0 0 0.00% 0.00 0.00%20 Orissa 22 64 257 306 553 5003 6205 11.64% 16.25% 4.61%21 Punjab 37 210 434 863 2958 14551 19053 23.95% 25.00% 1.05%22 Rajasthan 101 138 381 650 1320 8139 10729 13.49% 16.00% 2.51%23 Sikkim 3 3 7 3 19 138 173 3.19% 6.00% 2.81%24 Tamil Nadu 72 424 1244 0 5297 7924 14961 12.42% 18.00% 5.58%25 Tripura 31 28 164 103 909 4244 5479 12.37% 17.00% 4.63%26 Uttar Pradesh 162 190 1767 0 2923 20017 25059 6.80% 21.00% 14.20%27 Uttarakhand 10 24 88 0 445 1694 2261 10.88% 19.00% 8.12%28 West Bengal 41 71 650 771 0 6042 7575 10.38% 22.00% 11.62%29 A&N Islands 0 0 0 0 0 0 0 0.00% 0.00% 0.00%30 Chandigarh 1 11 41 20 103 472 648 8.23% 14.00% 5.77%31 D&N Haveli 0 0 0 1 5 23 29 8.92% 15.00% 6.08%32 Daman & Diu 0 1 3 7 14 43 68 24.20% 3.00% -21.20%33 Delhi 42 205 595 1074 3340 6405 11661 14.31% 15.00% 0.69%34 Lakshadweep 0 0 0 0 0 1 1 0.29% 0.00% -0.29%35 Puducherry 4 7 27 2 50 200 290 7.36% 16.00% 8.64%All <strong>India</strong> 1,056 2,965 10,965 10,758 36,639 133,694 196077 9.50%NA: Not Available80