- Page 1 and 2: The Rimba Raya Biodiversity Reserve
- Page 3 and 4: AcknowledgementsWith Special Recogn
- Page 5 and 6: ContentsContents ..................
- Page 7 and 8: BIODIVERSITY SECTION ..............
- Page 9 and 10: GLOSSARY OF PROJECT SPECIFIC TERMSC
- Page 11 and 12: REDD, which is necessarily conserva
- Page 13 and 14: Rehabilitation Center (OFI), home t
- Page 15 and 16: estricted-‐range, or otherwise
- Page 17 and 18: HydrologyWatersheds in the Project
- Page 19 and 20: SoilA soil map for the Project Zone
- Page 21 and 22: ClimateRainfall in the Project Zone
- Page 23 and 24: Compositionally, freshwater swamps
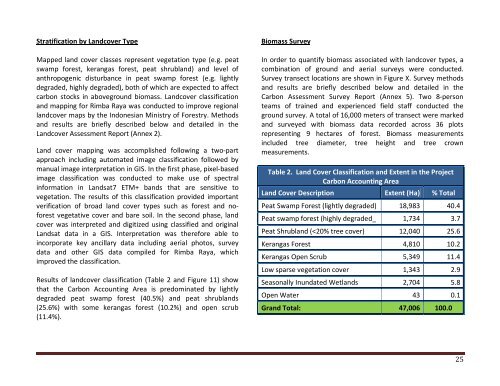
- Page 25 and 26: selective logging, intensive loggin
- Page 27 and 28: G1.3. Boundaries of the Project Are
- Page 29 and 30: Communities in the Project ZoneThe
- Page 31 and 32: Delineation of the Project Zone. To
- Page 33: the project and recommending that t
- Page 37 and 38: Stratification by Peat Distribution
- Page 39 and 40: G1.5. Description of Project Zone C
- Page 41 and 42: Only a few of the communities have
- Page 43 and 44: livelihoods, providing protection f
- Page 45 and 46: Similar to the other villages along
- Page 47 and 48: company. On average, farmers and fi
- Page 49 and 50: categories: housing, office, agricu
- Page 51 and 52: Table 6. Current Community Conflict
- Page 53 and 54: and six are Vulnerable (VU). CR spe
- Page 55 and 56: eight are listed as Vulnerable. Eig
- Page 57 and 58: 2004). These losses highlight the i
- Page 59 and 60: small mammal species richness decli
- Page 61 and 62: even fewer forest species than plan
- Page 63 and 64: Other threats to biodiversityAdditi
- Page 65 and 66: HCV1.1Table 8. Preliminary evaluati
- Page 67 and 68: of water supplies and prevention of
- Page 69 and 70: ladang agriculture, scrub, short se
- Page 71 and 72: Table 11. Critically Endangered Hig
- Page 73 and 74: d. areas that support significant c
- Page 75 and 76: G1.8.2. Significant Large Landscape
- Page 77 and 78: It is possible that a degree of per
- Page 79 and 80: The revised Toolkit for Indonesia i
- Page 81 and 82: the assessment area; and second, an
- Page 83 and 84: HCV 4.3HCV 4.3 aims to identify and
- Page 85 and 86:
Within the Project Area and neighbo
- Page 87 and 88:
G1.8.6. Areas Critical for Traditio
- Page 89 and 90:
In 2004, five oil palm estates were
- Page 91 and 92:
Figure 23. Comparison of the new dr
- Page 93 and 94:
Table 15. Extent of Overlap w/ Oil
- Page 95 and 96:
Baseline analysis: LandcoverIn orde
- Page 97 and 98:
All survey data has been entered in
- Page 99 and 100:
For a complete report on the Carbon
- Page 101 and 102:
Identification of Baseline Scenario
- Page 103 and 104:
Under Indonesian legislation, Law (
- Page 105 and 106:
drained due to the realization that
- Page 107 and 108:
conversion for urban, rural, and in
- Page 109 and 110:
to 2002. Furthermore, deforestation
- Page 111 and 112:
Local Perspective. Tanjung Puting N
- Page 113 and 114:
Table 17. 2000-‐2008 Palm Oil E
- Page 115 and 116:
Provincial Government Targets Rimba
- Page 117 and 118:
to recovery from past disturbance,
- Page 119 and 120:
StratumTable 20. Calculations of CO
- Page 121 and 122:
Year ofProjectArea loggedyr-‐1T
- Page 123 and 124:
GHG removals from oil palm sequestr
- Page 125 and 126:
Year ofProjectArea burnedyr-‐1T
- Page 127 and 128:
Year ofProjectArea burnedyr-‐1T
- Page 129 and 130:
Yr ofProjectTable 26. Net baseline
- Page 131 and 132:
environmental impacts and the need
- Page 133 and 134:
triggered by palm-‐oil companie
- Page 135 and 136:
G3. Project Design and GoalsG3.1. S
- Page 137 and 138:
elements and an assessment of the P
- Page 139 and 140:
habitat in terms of canopy and food
- Page 141 and 142:
Funding of OFI activitiesTanjung Pu
- Page 143 and 144:
interventions can improve the poor
- Page 145 and 146:
Community Agro-‐Forestry. In ke
- Page 147 and 148:
The only requirement is to pump the
- Page 149 and 150:
The Rimba Raya project proponents i
- Page 151 and 152:
www.kiva.org as highly reputable fi
- Page 153 and 154:
purchases more than $24 million dol
- Page 155 and 156:
The comparative analysis will be us
- Page 157 and 158:
G3.4. Project Lifetime, Accounting
- Page 159 and 160:
Table 28. Rimba Raya Implementation
- Page 161 and 162:
2-‐Establishment ofRimba RayaRe
- Page 163 and 164:
6-‐Development ofSocial Buffer2
- Page 165 and 166:
7-‐Outreach andEducation3-‐
- Page 167 and 168:
Pembuang Hulu and Tanjung Hanau reg
- Page 169 and 170:
.7. Determination of the need for s
- Page 171 and 172:
elationship with oil palm companies
- Page 173 and 174:
capital.” In order to ensure that
- Page 175 and 176:
G3.8. Stakeholder Identification an
- Page 177 and 178:
2. Improve multi-‐stakeholder p
- Page 179 and 180:
Community Involvement during Projec
- Page 181 and 182:
31 26/12/08 Burhanudin Merchant Des
- Page 183 and 184:
Table 31. Rimba Raya Project Proces
- Page 185 and 186:
G3.9. CCBA Public Comment PeriodDes
- Page 187 and 188:
In some contexts, for example where
- Page 189 and 190:
Table 32. Required Skill Sets , Key
- Page 191 and 192:
Develop areforestationprogramaround
- Page 193 and 194:
Figure 38 PT Rimba Raya Conservatio
- Page 195 and 196:
Figure 40. Project Organizational C
- Page 197 and 198:
manipulated to serve someone’s pe
- Page 199 and 200:
13). One area of special considerat
- Page 201 and 202:
also provide training in the skills
- Page 203 and 204:
Communitycenters &librariesWater fi
- Page 205 and 206:
C102 - Social Security (Minimum Sta
- Page 207 and 208:
G5.2. Documentation of Project Appr
- Page 209 and 210:
Figure 42. Official Land Area Verif
- Page 211 and 212:
Figure 44. Original Letter from Gov
- Page 213 and 214:
Figure 45. Original Minister’s De
- Page 215 and 216:
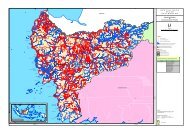
Encroachment by Palm Oil Plantation
- Page 217 and 218:
CLIMATE SECTIONCL1. Net Positive Cl
- Page 219 and 220:
CL1.5. Double Counting of Emissions
- Page 221 and 222:
Negative leakage is the unanticipat
- Page 223 and 224:
undervalued. Moreover, the argument
- Page 225 and 226:
et. al., 2005). However the long te
- Page 227 and 228:
edistributed such that the most eff
- Page 229 and 230:
The intersection of the hypothetica
- Page 231 and 232:
dedicated to bio-‐fuel producti
- Page 233 and 234:
Without project activities are disp
- Page 235 and 236:
Table 36. Assessment of risk factor
- Page 237 and 238:
Table 36. ...continuedRiskFactorLik
- Page 239 and 240:
Table 37. ...continuedRisk Factor %
- Page 241 and 242:
degraded portions of the Project Ar
- Page 243 and 244:
CL2.4. Leakage and non-CO2 GasesNon
- Page 245 and 246:
Monitoring of the boundary of the p
- Page 247 and 248:
Monitoring will be conducted by a p
- Page 249 and 250:
Table 38. InfiniteSUSTAINABILITY Ma
- Page 251 and 252:
Phinisi FloatingClinicMicro-Finance
- Page 253 and 254:
Table 39. Threats and management re
- Page 255 and 256:
Hunting - Communities in the Projec
- Page 257 and 258:
All five of these capital assets ar
- Page 259 and 260:
Hygiene improvesProportion of house
- Page 261 and 262:
LARASITAProject proponents will wor
- Page 263 and 264:
B1.2. Impact of Project Activities
- Page 265 and 266:
HCV 1.1 Support Function to Protect
- Page 267 and 268:
further losses. Protection of non-
- Page 269 and 270:
five are listed as Endangered by IU
- Page 271 and 272:
HCV 2.3 Areas that Contain Populati
- Page 273 and 274:
Table 42. Species to be used for Ri
- Page 275 and 276:
negative. In this scenario, net bio
- Page 277 and 278:
permanent 10-‐20 km transects s
- Page 279 and 280:
high resolution imagery) and field
- Page 281 and 282:
e present in the Seruyan River insi
- Page 283 and 284:
The Rimba Raya Project is located i
- Page 285 and 286:
intentionally or unintentionally, f
- Page 287 and 288:
GL3. Exceptional Biodiversity Benef
- Page 289 and 290:
Table 44. Endangered & Critically E
- Page 291 and 292:
GL3.2.2. Species with Large but Clu
- Page 293 and 294:
BIBLIOGRAPHYAnderson, J.A.R. (1972)
- Page 295 and 296:
Gibbs, H., (2008) Carbon payback ti
- Page 297 and 298:
Nicolas, Marc V.J. and Grant S. Bee
- Page 299 and 300:
Islands]. In Press.Susilo, H.D. (19