Tullow Oil plc Annual Report 2011 - The Group
Tullow Oil plc Annual Report 2011 - The Group
Tullow Oil plc Annual Report 2011 - The Group
- No tags were found...

Create successful ePaper yourself
Turn your PDF publications into a flip-book with our unique Google optimized e-Paper software.
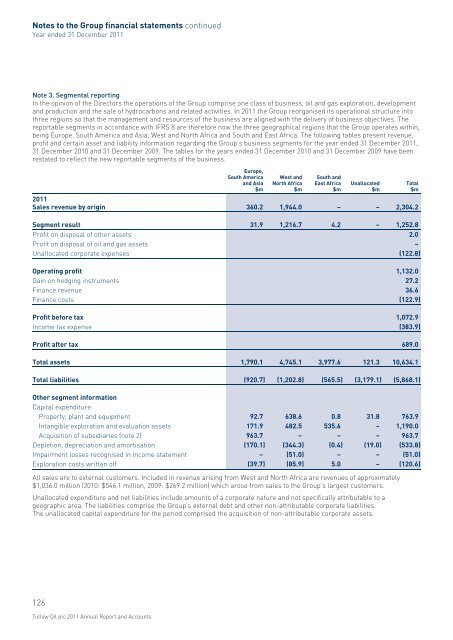
Notes to the <strong>Group</strong> financial statements continuedYear ended 31 December <strong>2011</strong>Note 3. Segmental reportingIn the opinion of the Directors the operations of the <strong>Group</strong> comprise one class of business, oil and gas exploration, developmentand production and the sale of hydrocarbons and related activities. In <strong>2011</strong> the <strong>Group</strong> reorganised its operational structure intothree regions so that the management and resources of the business are aligned with the delivery of business objectives. <strong>The</strong>reportable segments in accordance with IFRS 8 are therefore now the three geographical regions that the <strong>Group</strong> operates within,being Europe, South America and Asia; West and North Africa and South and East Africa. <strong>The</strong> following tables present revenue,profit and certain asset and liability information regarding the <strong>Group</strong>’s business segments for the year ended 31 December <strong>2011</strong>,31 December 2010 and 31 December 2009. <strong>The</strong> tables for the years ended 31 December 2010 and 31 December 2009 have beenrestated to reflect the new reportable segments of the business.Europe,South Americaand Asia$mWest andNorth Africa$mSouth andEast Africa$mUnallocated$m<strong>2011</strong>Sales revenue by origin 360.2 1,944.0 – – 2,304.2Total$mSegment result 31.9 1,216.7 4.2 – 1,252.8Profit on disposal of other assets 2.0Profit on disposal of oil and gas assets –Unallocated corporate expenses (122.8)Operating profit 1,132.0Gain on hedging instruments 27.2Finance revenue 36.6Finance costs (122.9)Profit before tax 1,072.9Income tax expense (383.9)Profit after tax 689.0Total assets 1,790.1 4,745.1 3,977.6 121.3 10,634.1Total liabilities (920.7) (1,202.8) (565.5) (3,179.1) (5,868.1)Other segment informationCapital expenditure:Property, plant and equipment 92.7 638.6 0.8 31.8 763.9Intangible exploration and evaluation assets 171.9 482.5 535.6 – 1,190.0Acquisition of subsidiaries (note 2) 963.7 – – – 963.7Depletion, depreciation and amortisation (170.1) (344.3) (0.4) (19.0) (533.8)Impairment losses recognised in income statement – (51.0) – – (51.0)Exploration costs written off (39.7) (85.9) 5.0 – (120.6)All sales are to external customers. Included in revenue arising from West and North Africa are revenues of approximately$1,036.0 million (2010: $546.1 million, 2009: $269.2 million) which arose from sales to the <strong>Group</strong>’s largest customers.Unallocated expenditure and net liabilities include amounts of a corporate nature and not specifically attributable to ageographic area. <strong>The</strong> liabilities comprise the <strong>Group</strong>’s external debt and other non-attributable corporate liabilities.<strong>The</strong> unallocated capital expenditure for the period comprised the acquisition of non-attributable corporate assets.126<strong>Tullow</strong> <strong>Oil</strong> <strong>plc</strong> <strong>2011</strong> <strong>Annual</strong> <strong>Report</strong> and Accounts