Tullow Oil plc Annual Report 2011 - The Group
Tullow Oil plc Annual Report 2011 - The Group
Tullow Oil plc Annual Report 2011 - The Group
- No tags were found...

You also want an ePaper? Increase the reach of your titles
YUMPU automatically turns print PDFs into web optimized ePapers that Google loves.
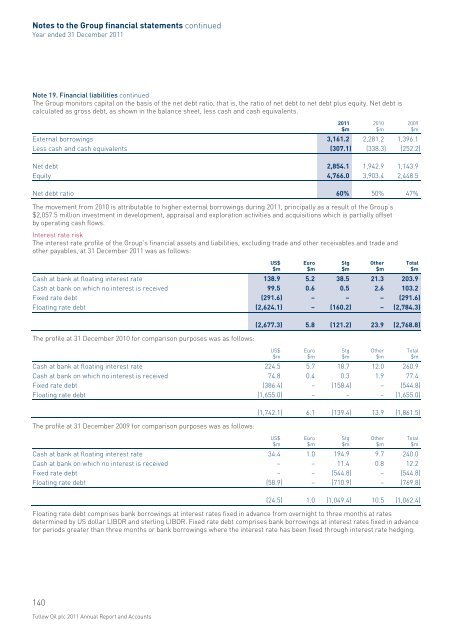
Notes to the <strong>Group</strong> financial statements continuedYear ended 31 December <strong>2011</strong>Note 19. Financial liabilities continued<strong>The</strong> <strong>Group</strong> monitors capital on the basis of the net debt ratio, that is, the ratio of net debt to net debt plus equity. Net debt iscalculated as gross debt, as shown in the balance sheet, less cash and cash equivalents.External borrowings 3,161.2 2,281.2 1,396.1Less cash and cash equivalents (307.1) (338.3) (252.2)<strong>2011</strong>$m2010$m2009$mNet debt 2,854.1 1,942.9 1,143.9Equity 4,766.0 3,903.4 2,448.5Net debt ratio 60% 50% 47%<strong>The</strong> movement from 2010 is attributable to higher external borrowings during <strong>2011</strong>, principally as a result of the <strong>Group</strong>’s$2,057.5 million investment in development, appraisal and exploration activities and acquisitions which is partially offsetby operating cash flows.Interest rate risk<strong>The</strong> interest rate profile of the <strong>Group</strong>’s financial assets and liabilities, excluding trade and other receivables and trade andother payables, at 31 December <strong>2011</strong> was as follows:Cash at bank at floating interest rate 138.9 5.2 38.5 21.3 203.9Cash at bank on which no interest is received 99.5 0.6 0.5 2.6 103.2Fixed rate debt (291.6) – – – (291.6)Floating rate debt (2,624.1) – (160.2) – (2,784.3)US$$mEuro$mStg$mOther$mTotal$m<strong>The</strong> profile at 31 December 2010 for comparison purposes was as follows:(2,677.3) 5.8 (121.2) 23.9 (2,768.8)Cash at bank at floating interest rate 224.5 5.7 18.7 12.0 260.9Cash at bank on which no interest is received 74.8 0.4 0.3 1.9 77.4Fixed rate debt (386.4) – (158.4) – (544.8)Floating rate debt (1,655.0) – – – (1,655.0)US$$mEuro$mStg$mOther$mTotal$m<strong>The</strong> profile at 31 December 2009 for comparison purposes was as follows:(1,742.1) 6.1 (139.4) 13.9 (1,861.5)Cash at bank at floating interest rate 34.4 1.0 194.9 9.7 240.0Cash at bank on which no interest is received – – 11.4 0.8 12.2Fixed rate debt – – (544.8) – (544.8)Floating rate debt (58.9) – (710.9) – (769.8)US$$mEuro$mStg$mOther$mTotal$m(24.5) 1.0 (1,049.4) 10.5 (1,062.4)Floating rate debt comprises bank borrowings at interest rates fixed in advance from overnight to three months at ratesdetermined by US dollar LIBOR and sterling LIBOR. Fixed rate debt comprises bank borrowings at interest rates fixed in advancefor periods greater than three months or bank borrowings where the interest rate has been fixed through interest rate hedging.140<strong>Tullow</strong> <strong>Oil</strong> <strong>plc</strong> <strong>2011</strong> <strong>Annual</strong> <strong>Report</strong> and Accounts