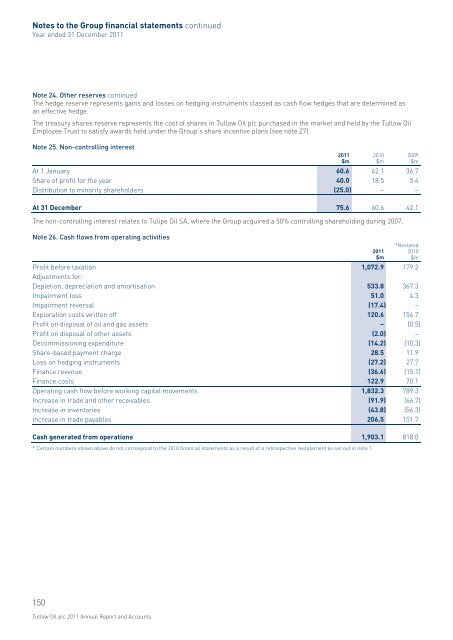
Notes to the <strong>Group</strong> financial statements continuedYear ended 31 December <strong>2011</strong>Note 24. Other reserves continued<strong>The</strong> hedge reserve represents gains and losses on hedging instruments classed as cash flow hedges that are determined asan effective hedge.<strong>The</strong> treasury shares reserve represents the cost of shares in <strong>Tullow</strong> <strong>Oil</strong> <strong>plc</strong> purchased in the market and held by the <strong>Tullow</strong> <strong>Oil</strong>Employee Trust to satisfy awards held under the <strong>Group</strong>’s share incentive plans (see note 27).Note 25. Non-controlling interestAt 1 January 60.6 42.1 36.7Share of profit for the year 40.0 18.5 5.4Distribution to minority shareholders (25.0) – –At 31 December 75.6 60.6 42.1<strong>The</strong> non-controlling interest relates to Tulipe <strong>Oil</strong> SA, where the <strong>Group</strong> acquired a 50% controlling shareholding during 2007.Note 26. Cash flows from operating activities<strong>2011</strong>$m2010$m<strong>2011</strong>$m2009$m*Restated2010$mProfit before taxation 1,072.9 179.2Adjustments for:Depletion, depreciation and amortisation 533.8 367.3Impairment loss 51.0 4.3Impairment reversal (17.4) –Exploration costs written off 120.6 154.7Profit on disposal of oil and gas assets – (0.5)Profit on disposal of other assets (2.0) –Decommissioning expenditure (14.2) (10.3)Share-based payment charge 28.5 11.9Loss on hedging instruments (27.2) 27.7Finance revenue (36.6) (15.1)Finance costs 122.9 70.1Operating cash flow before working capital movements 1,832.3 789.3Increase in trade and other receivables (91.9) (66.7)Increase in inventories (43.8) (56.3)Increase in trade payables 206.5 151.7Cash generated from operations 1,903.1 818.0* Certain numbers shown above do not correspond to the 2010 financial statements as a result of a retrospective restatement as set out in note 1.150<strong>Tullow</strong> <strong>Oil</strong> <strong>plc</strong> <strong>2011</strong> <strong>Annual</strong> <strong>Report</strong> and Accounts
5Note 27. Share-based payments2005 Performance Share Plan (PSP)Under the PSP, senior executives can be granted nil exercise price options (normally exercisable between three to ten yearsfollowing grant). At the <strong>2011</strong> <strong>Annual</strong> General Meeting, the annual grant limit for an individual was increased to 300,000 shares.Awards made before 8 March 2010 were made as conditional awards to acquire free shares on vesting. To provide flexibility toparticipants, those awards have been converted into nil exercise price options. Awards vest subject to a Total Shareholder Return(TSR) performance condition. 50% (70% for awards granted to Directors in <strong>2011</strong>) of an award is tested against a comparatorgroup of oil and gas companies. <strong>The</strong> remaining 50% (30% for awards granted to Directors in <strong>2011</strong>) is tested against constituentsof the FTSE 100 index (excluding investment trusts). Performance is measured over a fixed three-year period starting on1 January prior to grant, and an individual must normally remain in employment for three years from grant for the shares tovest. No dividends are paid over the vesting period. <strong>The</strong>re are further details of PSP award measurement in the Directors’Remuneration <strong>Report</strong> on pages 88 to 99.<strong>The</strong> shares outstanding under the PSP are as follows:FINANCIAL STATEMENTS<strong>2011</strong>Averageweighted share<strong>2011</strong> price at grantPSP sharesp2010Averageweighted share2010 price at grantPSP sharesp2009Averageweighted share2009 price at grantPSP sharespOutstanding at 1 January 4,101,876 978.6 4,305,486 687.0 3,856,913 552.9Granted 2,173,954 1342.6 1,274,971 1281.0 1,572,567 785.8Exercised during the year (389,126) 942.5 (1,441,136) 371.2 (1,095,350) 354.1Forfeited/expired during the year (29,170) 1249.8 (37,445) 1120.7 (28,644) 780.3Outstanding at 31 December 5,857,534 1116.0 4,101,876 978.6 4,305,486 687.0<strong>The</strong> inputs of the option valuation model were:Risk free interest rate 1.6% pa 1.9% pa 1.9% paExpected volatility 49% 52% 54%Dividend yield 0.4% pa 0.5% pa 0.8% pa<strong>The</strong> expected life is the period from date of grant to vesting. Expected volatility was determined by calculating the historicalvolatility of the Company’s share price over a period commensurate with the expected life of the awards. <strong>The</strong> weighted averagefair value of the awards granted in <strong>2011</strong> was 728.8p per share subject to an award (2010: 700.8p, 2009: 579.9p).<strong>The</strong> <strong>Group</strong> recognised a total charge of $17.0 million (2010: $12.6 million, 2009: $9.4 million) in respect of the PSP.2005 Deferred Share Bonus Plan (DSBP)Under the DSBP, the portion of any annual bonus above 75% of the base salary of a senior executive nominated by theRemuneration Committee is deferred into shares. Awards normally vest following the end of three financial years commencingwith that in which they are granted. <strong>The</strong>y are granted as nil exercise price options, normally exercisable from when they vest until10 years from grant. Awards granted before 8 March 2010 as conditional awards to acquire free shares have been converted intonil exercise price options to provide flexibility to participants.<strong>The</strong> shares outstanding under the DSBP are as follows:<strong>2011</strong>DSBP shares<strong>2011</strong>Share priceat grantp2010DSBP shares2010Share priceat grantp2009DSBP shares2009Share priceat grantpOutstanding at 1 January 301,951 896.6 231,457 716.3 200,633 507.9Granted 65,926 1362.0 92,939 1281.0 135,291 778.0Exercised during the year – – (22,445) 629.5 (104,467) 396.0Outstanding at 31 December 367,877 980.0 301,951 896.6 231,457 716.3<strong>The</strong> inputs of the option valuation model were:Dividend yield 0.4% pa 0.5% pa 1.0% pa<strong>The</strong> expected life is the period from the date of grant to the vesting date. <strong>The</strong> fair value of the awards granted in <strong>2011</strong> was 1344.1pper share subject to an award (2010: 1263.1p, 2009: 760.2p).<strong>The</strong> <strong>Group</strong> recognised a total charge of $1.7 million (2010: $1.3 million, 2009: $0.8 million) in respect of the DSBP.151www.tullowoil.com
- Page 4 and 5:
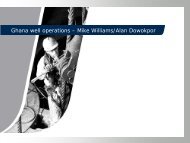
Production operators in the central
- Page 6:
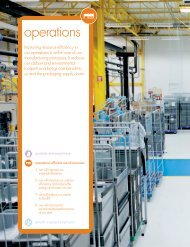
2011 highlightsRECORD RESULTSIndust
- Page 11 and 12:
In Ghana, we have experienced techn
- Page 13 and 14:
More informationPageStrong organisa
- Page 15 and 16:
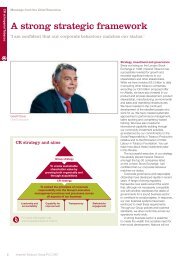
CLEARVISIONSPECIAL FEATURETO BE THE
- Page 17 and 18:
1Exploration& appraisal7Sharedprosp
- Page 19 and 20:
EXPLORATION& APPRAISALStrategic pri
- Page 21 and 22:
DELIVERING MATERIALPRODUCTIONGROWTH
- Page 23 and 24:
21www.tullowoil.com
- Page 25:
RISKMANAGEMENTStrategic priority: E
- Page 28 and 29:
MAINTAINING OURENTREPRENEURIALCHARA
- Page 30 and 31:
SHAREDPROSPERITYStrategic priority:
- Page 32 and 33:
DELIVERINGSUBSTANTIAL RETURNSOur st
- Page 34 and 35:
Key Performance Indicators continue
- Page 36 and 37:
Financial reviewFUNDING FUTURE GROW
- Page 38 and 39:
Financial review continued2011 Grou
- Page 40 and 41:
Financial review continuedDividendT
- Page 43 and 44:
Regional business management unitsI
- Page 45 and 46:
LONG-TERMPERFORMANCE RISKSWe group
- Page 47 and 48:
1Operational risk continuedKey deve
- Page 49 and 50:
482011 operations overviewOverall,
- Page 51 and 52:
2OPERATIONS REVIEWEurope,South Amer
- Page 53 and 54:
DEVELOPMENT & OPERATIONSA new scale
- Page 55 and 56:
Senior DrillingSupervisor withtrain
- Page 57 and 58:
Mauritania & SenegalProduction from
- Page 59 and 60:
periods for Kasamene, Wahrindi, Kig
- Page 61 and 62:
2West African and South American ex
- Page 63 and 64:
62Creating shared prosperityCreatin
- Page 65 and 66:
More informationPageSpecial feature
- Page 67 and 68:
Social performance standardsWe are
- Page 69 and 70:
3The effect of Uncontrolled Release
- Page 71 and 72:
3Future talent poolIn October 2011,
- Page 73 and 74:
3LOCAL CONTENTCreating real opportu
- Page 75 and 76:
3Key corporate responsibility polic
- Page 77 and 78:
76Chairman’s introductionAt Board
- Page 79 and 80:
4In order to provide the human and
- Page 81 and 82:
I am delighted to have taken on the
- Page 83 and 84:
Board of DirectorsEXPERIENCED LEADE
- Page 85 and 86:
4CORPORATE GOVERNANCEAnn GrantNon-e
- Page 87 and 88:
Audit planning and update on releva
- Page 89 and 90:
Directors in their place. On 12 May
- Page 91:
CONTENTS89 Introduction89 Remunerat
- Page 94 and 95:
Directors’ remuneration report co
- Page 96 and 97:
Directors’ remuneration report co
- Page 98 and 99:
Directors’ remuneration report co
- Page 100 and 101:
Directors’ remuneration report co
- Page 102 and 103: Corporate governanceThe UK Corporat
- Page 104 and 105: Corporate governance continuedThe f
- Page 106 and 107: Corporate governance continuedAccou
- Page 108 and 109: Other statutory informationResults
- Page 111 and 112: All employees are helped and encour
- Page 113 and 114: As part of our Code of Business Con
- Page 115 and 116: Independent Auditor’s Reportto th
- Page 117 and 118: Group balance sheetAs at 31 Decembe
- Page 119 and 120: Group cash flow statementYear ended
- Page 121 and 122: The principal accounting policies a
- Page 123 and 124: 5Finance costs of debt are allocate
- Page 125 and 126: 5Commercial reserves estimates (not
- Page 127 and 128: 5Note 2. Business combinationsOn 24
- Page 129 and 130: 5Europe,South Americaand Asia$mWest
- Page 131 and 132: 5Non-current assets by originGhana
- Page 133 and 134: 5Note 6. Staff costsThe average mon
- Page 135 and 136: 5The Group’s profit before taxati
- Page 137 and 138: 5Note 12. Property, plant and equip
- Page 139 and 140: 5Note 13. Investments2011$m2010$m20
- Page 141 and 142: 5Note 18. Trade and other payablesC
- Page 143 and 144: 5The $3.5 billion Reserves Based Le
- Page 145 and 146: 5Note 20. Financial instrumentsFina
- Page 147 and 148: 5Oil and gas pricesThe Group uses a
- Page 149 and 150: 5Financial derivativesThe Group int
- Page 151: 5Deferred tax assets are recognised
- Page 155 and 156: 5UK & Irish Share Incentive Plans (
- Page 157 and 158: Independent Auditor’s Reportto th
- Page 159 and 160: Company balance sheetAs at 31 Decem
- Page 161 and 162: Notes to the Company financial stat
- Page 163 and 164: 5Note 6. Bank loansCurrentShort-ter
- Page 165 and 166: 5Note 9. Shareholders’ fundsShare
- Page 167 and 168: 2010 Share Option Plan (2010 SOP) a
- Page 169 and 170: 5Note 13. Subsequent eventsSince th
- Page 171 and 172: Commercial reserves and contingent
- Page 173 and 174: Area TullowLicenceFieldssq km inter
- Page 175 and 176: Licence / BlocksFieldsAreasq kmTull
- Page 177 and 178: ContactsSecretary & registered offi
- Page 179 and 180: KKenya 6, 7, 57Key financial metric
- Page 181 and 182: MmmbblmmboemmscfdMoUMTMMillion barr
- Page 183 and 184: This report is printed on Heaven 42