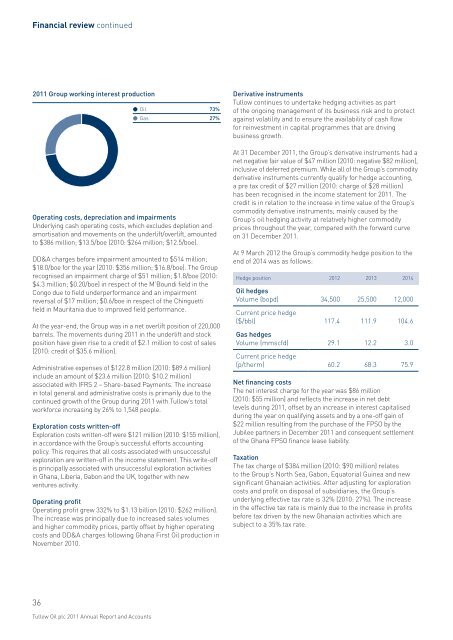
Financial review continued<strong>2011</strong> <strong>Group</strong> working interest production<strong>Oil</strong> 73%Gas 27%Operating costs, depreciation and impairmentsUnderlying cash operating costs, which excludes depletion andamortisation and movements on the underlift/overlift, amountedto $386 million; $13.5/boe (2010: $264 million; $12.5/boe).DD&A charges before impairment amounted to $514 million;$18.0/boe for the year (2010: $356 million; $16.8/boe). <strong>The</strong> <strong>Group</strong>recognised an impairment charge of $51 million; $1.8/boe (2010:$4.3 million; $0.20/boe) in respect of the M’Boundi field in theCongo due to field underperformance and an impairmentreversal of $17 million; $0.6/boe in respect of the Chinguettifield in Mauritania due to improved field performance.At the year-end, the <strong>Group</strong> was in a net overlift position of 220,000barrels. <strong>The</strong> movements during <strong>2011</strong> in the underlift and stockposition have given rise to a credit of $2.1 million to cost of sales(2010: credit of $35.6 million).Administrative expenses of $122.8 million (2010: $89.6 million)include an amount of $23.6 million (2010: $10.2 million)associated with IFRS 2 – Share-based Payments. <strong>The</strong> increasein total general and administrative costs is primarily due to thecontinued growth of the <strong>Group</strong> during <strong>2011</strong> with <strong>Tullow</strong>’s totalworkforce increasing by 26% to 1,548 people.Exploration costs written-offExploration costs written-off were $121 million (2010: $155 million),in accordance with the <strong>Group</strong>’s successful efforts accountingpolicy. This requires that all costs associated with unsuccessfulexploration are written-off in the income statement. This write-offis principally associated with unsuccessful exploration activitiesin Ghana, Liberia, Gabon and the UK, together with newventures activity.Operating profitOperating profit grew 332% to $1.13 billion (2010: $262 million).<strong>The</strong> increase was principally due to increased sales volumesand higher commodity prices, partly offset by higher operatingcosts and DD&A charges following Ghana First <strong>Oil</strong> production inNovember 2010.Derivative instruments<strong>Tullow</strong> continues to undertake hedging activities as partof the ongoing management of its business risk and to protectagainst volatility and to ensure the availability of cash flowfor reinvestment in capital programmes that are drivingbusiness growth.At 31 December <strong>2011</strong>, the <strong>Group</strong>’s derivative instruments had anet negative fair value of $47 million (2010: negative $82 million),inclusive of deferred premium. While all of the <strong>Group</strong>’s commodityderivative instruments currently qualify for hedge accounting,a pre tax credit of $27 million (2010: charge of $28 million)has been recognised in the income statement for <strong>2011</strong>. <strong>The</strong>credit is in relation to the increase in time value of the <strong>Group</strong>’scommodity derivative instruments; mainly caused by the<strong>Group</strong>’s oil hedging activity at relatively higher commodityprices throughout the year, compared with the forward curveon 31 December <strong>2011</strong>.At 9 March 2012 the <strong>Group</strong>’s commodity hedge position to theend of 2014 was as follows:Hedge position 2012 2013 2014<strong>Oil</strong> hedgesVolume (bopd) 34,500 25,500 12,000Current price hedge($/bbl) 117.4 111.9 104.6Gas hedgesVolume (mmscfd) 29.1 12.2 3.0Current price hedge(p/therm) 60.2 68.3 75.9Net financing costs<strong>The</strong> net interest charge for the year was $86 million(2010: $55 million) and reflects the increase in net debtlevels during <strong>2011</strong>, offset by an increase in interest capitalisedduring the year on qualifying assets and by a one-off gain of$22 million resulting from the purchase of the FPSO by theJubilee partners in December <strong>2011</strong> and consequent settlementof the Ghana FPSO finance lease liability.Taxation<strong>The</strong> tax charge of $384 million (2010: $90 million) relatesto the <strong>Group</strong>’s North Sea, Gabon, Equatorial Guinea and newsignificant Ghanaian activities. After adjusting for explorationcosts and profit on disposal of subsidiaries, the <strong>Group</strong>’sunderlying effective tax rate is 32% (2010: 27%). <strong>The</strong> increasein the effective tax rate is mainly due to the increase in profitsbefore tax driven by the new Ghanaian activities which aresubject to a 35% tax rate.36<strong>Tullow</strong> <strong>Oil</strong> <strong>plc</strong> <strong>2011</strong> <strong>Annual</strong> <strong>Report</strong> and Accounts
Operating cash flowHigher production and increased commodity prices droveoperating cash flow before working capital movements 132%higher to $1.8 billion (2010: $789 million). In <strong>2011</strong>, this cash flowtogether with increased debt facilities helped fund $1.7 billioncapital investment in exploration and development activities,$502 million on acquisitions, $114 million payment of dividendsand the servicing of debt facilities.Summary cash flow<strong>2011</strong> 2010Sales revenue 2,304 1,090Operating costs (386) (264)Operating expenses (86) (37)Cash flow from operations 1,832 789Working capital and tax (101) (57)Capital expenditure (1,653) (1,179)Investing activities (388) (1,612)Financing activities 279 2,149Net (decrease)/increase in cash (31) 90Capital expenditure<strong>2011</strong> capital expenditure amounted to $1.4 billion (2010: $1.2billion) with 28% invested on development activities, 23% onappraisal activities and 49% on exploration activities. More than50% of the total was invested in Ghana and Uganda and over80%, more than $1.2 billion, was invested in Africa. Based oncurrent estimates and work programmes, 2012 capitalexpenditure is forecast to reach $2.0 billion.Portfolio managementOn 30 June <strong>2011</strong>, <strong>Tullow</strong> completed the acquisition ofNuon E&P from the Vattenfall <strong>Group</strong> for a cash considerationof €300 million ($432 million), before working capitaladjustments. This added a portfolio of 25 licences, over30 producing fields as well as various development andexploration opportunities together with ownership ofkey infrastructure.On 25 July <strong>2011</strong>, <strong>Tullow</strong> completed the acquisition of theGhanaian interests of EO <strong>Group</strong> Limited (EO) for a combinedcash and share consideration of $305 million, before workingcapital adjustments. This increased <strong>Tullow</strong>’s interest in theWest Cape Three points licence by 3.5% to 26.4% and increasedthe <strong>Group</strong>’s interest in the Jubilee fields by 1.75% to 36.5%.Ghana share listingIn July <strong>2011</strong>, <strong>Tullow</strong> allotted 3,531,546 ordinary shares of 10peach in the capital of <strong>Tullow</strong>, which rank pari passu with theexisting shares in issue, pursuant to the offer for subscriptionof up to 4,000,000 shares in connection with <strong>Tullow</strong>’s secondarylisting on the Ghana Stock Exchange (GSE). This representeda total amount of 109,477,926 Ghana Cedis (approximately$72.3 million). It was the largest primary share offer evercompleted on the GSE and has more than doubled themarket capitalisation of the GSE. <strong>The</strong> first day of tradingwas on 27 July <strong>2011</strong>.1BUSINESS REVIEW<strong>2011</strong> capital expenditure$1.4 BILLION2010: $1.2 BILLION2012 forecast capital expenditure$2.0 BILLIONExploration 35%1500Appraisal 15%12009006003883886596515207153961,036Development 50%300392392538024107 08 09 10 11D&OE&A07080910111237www.tullowoil.com
- Page 4 and 5: Production operators in the central
- Page 6: 2011 highlightsRECORD RESULTSIndust
- Page 11 and 12: In Ghana, we have experienced techn
- Page 13 and 14: More informationPageStrong organisa
- Page 15 and 16: CLEARVISIONSPECIAL FEATURETO BE THE
- Page 17 and 18: 1Exploration& appraisal7Sharedprosp
- Page 19 and 20: EXPLORATION& APPRAISALStrategic pri
- Page 21 and 22: DELIVERING MATERIALPRODUCTIONGROWTH
- Page 23 and 24: 21www.tullowoil.com
- Page 25: RISKMANAGEMENTStrategic priority: E
- Page 28 and 29: MAINTAINING OURENTREPRENEURIALCHARA
- Page 30 and 31: SHAREDPROSPERITYStrategic priority:
- Page 32 and 33: DELIVERINGSUBSTANTIAL RETURNSOur st
- Page 34 and 35: Key Performance Indicators continue
- Page 36 and 37: Financial reviewFUNDING FUTURE GROW
- Page 40 and 41: Financial review continuedDividendT
- Page 43 and 44: Regional business management unitsI
- Page 45 and 46: LONG-TERMPERFORMANCE RISKSWe group
- Page 47 and 48: 1Operational risk continuedKey deve
- Page 49 and 50: 482011 operations overviewOverall,
- Page 51 and 52: 2OPERATIONS REVIEWEurope,South Amer
- Page 53 and 54: DEVELOPMENT & OPERATIONSA new scale
- Page 55 and 56: Senior DrillingSupervisor withtrain
- Page 57 and 58: Mauritania & SenegalProduction from
- Page 59 and 60: periods for Kasamene, Wahrindi, Kig
- Page 61 and 62: 2West African and South American ex
- Page 63 and 64: 62Creating shared prosperityCreatin
- Page 65 and 66: More informationPageSpecial feature
- Page 67 and 68: Social performance standardsWe are
- Page 69 and 70: 3The effect of Uncontrolled Release
- Page 71 and 72: 3Future talent poolIn October 2011,
- Page 73 and 74: 3LOCAL CONTENTCreating real opportu
- Page 75 and 76: 3Key corporate responsibility polic
- Page 77 and 78: 76Chairman’s introductionAt Board
- Page 79 and 80: 4In order to provide the human and
- Page 81 and 82: I am delighted to have taken on the
- Page 83 and 84: Board of DirectorsEXPERIENCED LEADE
- Page 85 and 86: 4CORPORATE GOVERNANCEAnn GrantNon-e
- Page 87 and 88: Audit planning and update on releva
- Page 89 and 90:
Directors in their place. On 12 May
- Page 91:
CONTENTS89 Introduction89 Remunerat
- Page 94 and 95:
Directors’ remuneration report co
- Page 96 and 97:
Directors’ remuneration report co
- Page 98 and 99:
Directors’ remuneration report co
- Page 100 and 101:
Directors’ remuneration report co
- Page 102 and 103:
Corporate governanceThe UK Corporat
- Page 104 and 105:
Corporate governance continuedThe f
- Page 106 and 107:
Corporate governance continuedAccou
- Page 108 and 109:
Other statutory informationResults
- Page 111 and 112:
All employees are helped and encour
- Page 113 and 114:
As part of our Code of Business Con
- Page 115 and 116:
Independent Auditor’s Reportto th
- Page 117 and 118:
Group balance sheetAs at 31 Decembe
- Page 119 and 120:
Group cash flow statementYear ended
- Page 121 and 122:
The principal accounting policies a
- Page 123 and 124:
5Finance costs of debt are allocate
- Page 125 and 126:
5Commercial reserves estimates (not
- Page 127 and 128:
5Note 2. Business combinationsOn 24
- Page 129 and 130:
5Europe,South Americaand Asia$mWest
- Page 131 and 132:
5Non-current assets by originGhana
- Page 133 and 134:
5Note 6. Staff costsThe average mon
- Page 135 and 136:
5The Group’s profit before taxati
- Page 137 and 138:
5Note 12. Property, plant and equip
- Page 139 and 140:
5Note 13. Investments2011$m2010$m20
- Page 141 and 142:
5Note 18. Trade and other payablesC
- Page 143 and 144:
5The $3.5 billion Reserves Based Le
- Page 145 and 146:
5Note 20. Financial instrumentsFina
- Page 147 and 148:
5Oil and gas pricesThe Group uses a
- Page 149 and 150:
5Financial derivativesThe Group int
- Page 151 and 152:
5Deferred tax assets are recognised
- Page 153 and 154:
5Note 27. Share-based payments2005
- Page 155 and 156:
5UK & Irish Share Incentive Plans (
- Page 157 and 158:
Independent Auditor’s Reportto th
- Page 159 and 160:
Company balance sheetAs at 31 Decem
- Page 161 and 162:
Notes to the Company financial stat
- Page 163 and 164:
5Note 6. Bank loansCurrentShort-ter
- Page 165 and 166:
5Note 9. Shareholders’ fundsShare
- Page 167 and 168:
2010 Share Option Plan (2010 SOP) a
- Page 169 and 170:
5Note 13. Subsequent eventsSince th
- Page 171 and 172:
Commercial reserves and contingent
- Page 173 and 174:
Area TullowLicenceFieldssq km inter
- Page 175 and 176:
Licence / BlocksFieldsAreasq kmTull
- Page 177 and 178:
ContactsSecretary & registered offi
- Page 179 and 180:
KKenya 6, 7, 57Key financial metric
- Page 181 and 182:
MmmbblmmboemmscfdMoUMTMMillion barr
- Page 183 and 184:
This report is printed on Heaven 42