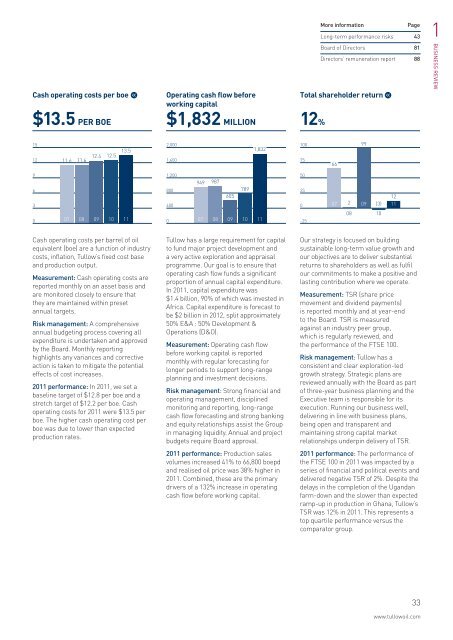
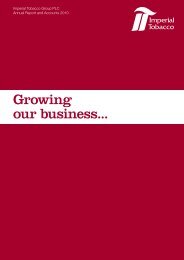
Key Performance Indicators continuedFINANCIALWe measure a range ofoperational and financialmetrics to help us in managingour performance and achievingour business plans.EXECUTIVE DIRECTORREMUNERATION<strong>The</strong> bonus element of ExecutiveDirector remuneration islinked to TSR, LTIFR, Workinginterest production, cashoperating costs per boe, findingcosts per boe and growth inresources. In addition, eachyear a range of finance andportfolio management, andregional operating objectivesare set, which are aligned withthe <strong>Group</strong>’s business plan. Eachelement has a weighting anda performance target. In <strong>2011</strong>,the Remuneration Committeeawarded Executive Directors abonus of 80% of the maximumannual bonus potential. Furtherinformation is set out onpage 92 of this report.»Linked to executive remunerationReserves andresources replacement959%1,5001,20090060030004341,2324371,33995907 08 09 10 11<strong>Tullow</strong> has an exploration-led growthstrategy. Replacement of reserves andresources is a key measure of explorationsuccess and is focused on continuing togrow the <strong>Group</strong>’s production profile andportfolio management potential.Measurement: Proven and probableCommercial reserves are based ona <strong>Group</strong> reserves report produced byan independent engineer. Reservesestimates for each field are reviewedby the independent engineer basedon significant new data or a materialchange with a review of each fieldundertaken at least every two years.Risk management: <strong>The</strong> <strong>Group</strong> managesreplacement risk by focusing on findinghigh value oil in material quantities incore areas and geological plays and bymaximising reservoir performance inproducing fields, through operationaland technical excellence.<strong>2011</strong> performance: <strong>The</strong> <strong>Group</strong> achieved959% organic reserves and resourcesreplacement in <strong>2011</strong> and has totalreserves and resources of 1,742.8mmboe. Post completion of thefarm-down in Uganda, total reservesand resources are expected to be1,139.0 mmboe.Working interestproduction78,200 BOEPD80,00073,10078,20066,60064,00058,300 58,10048,00032,00016,000007 08 09 10 11<strong>Tullow</strong> sets working interest productiontargets as part of the <strong>Group</strong>’s annualbudget process. We aim to grow ourproduction profile to fund substantially anannual high-impact E&A programme,which is central to our successfulexploration-led growth strategy.Measurement: Daily and weeklyproduction are monitored from all keyproducing assets. Production is reportedweekly to Senior Management and on amonthly basis to the Board. Regularproduction forecasts are prepared duringthe year to measure progress againstannual targets.Risk management: Strong productionplanning and monitoring mitigatesunplanned interruptions. When issuesarise, such as with the design of wellcompletions in the new Jubilee field inGhana, we take a prudent approach toensure that we determine the rightsolution for the medium to long term andimplement this to protect the reservesand resources of this asset.<strong>2011</strong> performance: <strong>The</strong> <strong>Group</strong>’s baselineproduction target for <strong>2011</strong> was 87,800boepd; the stretch target was 92,190boepd. <strong>2011</strong> actual production wasbelow both targets.32<strong>Tullow</strong> <strong>Oil</strong> <strong>plc</strong> <strong>2011</strong> <strong>Annual</strong> <strong>Report</strong> and Accounts
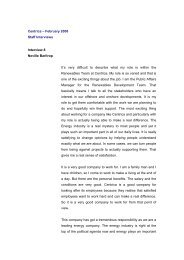
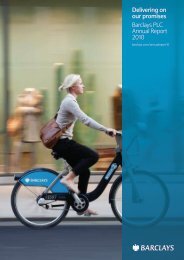
More informationPageLong-term performance risks 431Cash operating costs per boe$13.5 PER BOEOperating cash flow beforeworking capital$1,832 MILLIONTotal shareholder return12%Board of Directors 81Directors’ remuneration report 88BUSINESS REVIEW151211.611.612.412.513.52,0001,6001,832100756699963007 08 09 10 111,200800400094998760578907 08 09 10 1150250-251207 2 09 (3) 1108 10Cash operating costs per barrel of oilequivalent (boe) are a function of industrycosts, inflation, <strong>Tullow</strong>’s fixed cost baseand production output.Measurement: Cash operating costs arereported monthly on an asset basis andare monitored closely to ensure thatthey are maintained within presetannual targets.Risk management: A comprehensiveannual budgeting process covering allexpenditure is undertaken and approvedby the Board. Monthly reportinghighlights any variances and correctiveaction is taken to mitigate the potentialeffects of cost increases.<strong>2011</strong> performance: In <strong>2011</strong>, we set abaseline target of $12.8 per boe and astretch target of $12.2 per boe. Cashoperating costs for <strong>2011</strong> were $13.5 perboe. <strong>The</strong> higher cash operating cost perboe was due to lower than expectedproduction rates.<strong>Tullow</strong> has a large requirement for capitalto fund major project development anda very active exploration and appraisalprogramme. Our goal is to ensure thatoperating cash flow funds a significantproportion of annual capital expenditure.In <strong>2011</strong>, capital expenditure was$1.4 billion, 90% of which was invested inAfrica. Capital expenditure is forecast tobe $2 billion in 2012, split approximately50% E&A : 50% Development &Operations (D&O).Measurement: Operating cash flowbefore working capital is reportedmonthly with regular forecasting forlonger periods to support long-rangeplanning and investment decisions.Risk management: Strong financial andoperating management, disciplinedmonitoring and reporting, long-rangecash flow forecasting and strong bankingand equity relationships assist the <strong>Group</strong>in managing liquidity. <strong>Annual</strong> and projectbudgets require Board approval.<strong>2011</strong> performance: Production salesvolumes increased 41% to 66,800 boepdand realised oil price was 38% higher in<strong>2011</strong>. Combined, these are the primarydrivers of a 132% increase in operatingcash flow before working capital.Our strategy is focused on buildingsustainable long-term value growth andour objectives are to deliver substantialreturns to shareholders as well as fulfilour commitments to make a positive andlasting contribution where we operate.Measurement: TSR (share pricemovement and dividend payments)is reported monthly and at year-endto the Board. TSR is measuredagainst an industry peer group,which is regularly reviewed, andthe performance of the FTSE 100.Risk management: <strong>Tullow</strong> has aconsistent and clear exploration-ledgrowth strategy. Strategic plans arereviewed annually with the Board as partof three-year business planning and theExecutive team is responsible for itsexecution. Running our business well,delivering in line with business plans,being open and transparent andmaintaining strong capital marketrelationships underpin delivery of TSR.<strong>2011</strong> performance: <strong>The</strong> performance ofthe FTSE 100 in <strong>2011</strong> was impacted by aseries of financial and political events anddelivered negative TSR of 2%. Despite thedelays in the completion of the Ugandanfarm-down and the slower than expectedramp-up in production in Ghana, <strong>Tullow</strong>‘sTSR was 12% in <strong>2011</strong>. This represents atop quartile performance versus thecomparator group.33www.tullowoil.com
- Page 4 and 5: Production operators in the central
- Page 6: 2011 highlightsRECORD RESULTSIndust
- Page 11 and 12: In Ghana, we have experienced techn
- Page 13 and 14: More informationPageStrong organisa
- Page 15 and 16: CLEARVISIONSPECIAL FEATURETO BE THE
- Page 17 and 18: 1Exploration& appraisal7Sharedprosp
- Page 19 and 20: EXPLORATION& APPRAISALStrategic pri
- Page 21 and 22: DELIVERING MATERIALPRODUCTIONGROWTH
- Page 23 and 24: 21www.tullowoil.com
- Page 25: RISKMANAGEMENTStrategic priority: E
- Page 28 and 29: MAINTAINING OURENTREPRENEURIALCHARA
- Page 30 and 31: SHAREDPROSPERITYStrategic priority:
- Page 32 and 33: DELIVERINGSUBSTANTIAL RETURNSOur st
- Page 36 and 37: Financial reviewFUNDING FUTURE GROW
- Page 38 and 39: Financial review continued2011 Grou
- Page 40 and 41: Financial review continuedDividendT
- Page 43 and 44: Regional business management unitsI
- Page 45 and 46: LONG-TERMPERFORMANCE RISKSWe group
- Page 47 and 48: 1Operational risk continuedKey deve
- Page 49 and 50: 482011 operations overviewOverall,
- Page 51 and 52: 2OPERATIONS REVIEWEurope,South Amer
- Page 53 and 54: DEVELOPMENT & OPERATIONSA new scale
- Page 55 and 56: Senior DrillingSupervisor withtrain
- Page 57 and 58: Mauritania & SenegalProduction from
- Page 59 and 60: periods for Kasamene, Wahrindi, Kig
- Page 61 and 62: 2West African and South American ex
- Page 63 and 64: 62Creating shared prosperityCreatin
- Page 65 and 66: More informationPageSpecial feature
- Page 67 and 68: Social performance standardsWe are
- Page 69 and 70: 3The effect of Uncontrolled Release
- Page 71 and 72: 3Future talent poolIn October 2011,
- Page 73 and 74: 3LOCAL CONTENTCreating real opportu
- Page 75 and 76: 3Key corporate responsibility polic
- Page 77 and 78: 76Chairman’s introductionAt Board
- Page 79 and 80: 4In order to provide the human and
- Page 81 and 82: I am delighted to have taken on the
- Page 83 and 84: Board of DirectorsEXPERIENCED LEADE
- Page 85 and 86:
4CORPORATE GOVERNANCEAnn GrantNon-e
- Page 87 and 88:
Audit planning and update on releva
- Page 89 and 90:
Directors in their place. On 12 May
- Page 91:
CONTENTS89 Introduction89 Remunerat
- Page 94 and 95:
Directors’ remuneration report co
- Page 96 and 97:
Directors’ remuneration report co
- Page 98 and 99:
Directors’ remuneration report co
- Page 100 and 101:
Directors’ remuneration report co
- Page 102 and 103:
Corporate governanceThe UK Corporat
- Page 104 and 105:
Corporate governance continuedThe f
- Page 106 and 107:
Corporate governance continuedAccou
- Page 108 and 109:
Other statutory informationResults
- Page 111 and 112:
All employees are helped and encour
- Page 113 and 114:
As part of our Code of Business Con
- Page 115 and 116:
Independent Auditor’s Reportto th
- Page 117 and 118:
Group balance sheetAs at 31 Decembe
- Page 119 and 120:
Group cash flow statementYear ended
- Page 121 and 122:
The principal accounting policies a
- Page 123 and 124:
5Finance costs of debt are allocate
- Page 125 and 126:
5Commercial reserves estimates (not
- Page 127 and 128:
5Note 2. Business combinationsOn 24
- Page 129 and 130:
5Europe,South Americaand Asia$mWest
- Page 131 and 132:
5Non-current assets by originGhana
- Page 133 and 134:
5Note 6. Staff costsThe average mon
- Page 135 and 136:
5The Group’s profit before taxati
- Page 137 and 138:
5Note 12. Property, plant and equip
- Page 139 and 140:
5Note 13. Investments2011$m2010$m20
- Page 141 and 142:
5Note 18. Trade and other payablesC
- Page 143 and 144:
5The $3.5 billion Reserves Based Le
- Page 145 and 146:
5Note 20. Financial instrumentsFina
- Page 147 and 148:
5Oil and gas pricesThe Group uses a
- Page 149 and 150:
5Financial derivativesThe Group int
- Page 151 and 152:
5Deferred tax assets are recognised
- Page 153 and 154:
5Note 27. Share-based payments2005
- Page 155 and 156:
5UK & Irish Share Incentive Plans (
- Page 157 and 158:
Independent Auditor’s Reportto th
- Page 159 and 160:
Company balance sheetAs at 31 Decem
- Page 161 and 162:
Notes to the Company financial stat
- Page 163 and 164:
5Note 6. Bank loansCurrentShort-ter
- Page 165 and 166:
5Note 9. Shareholders’ fundsShare
- Page 167 and 168:
2010 Share Option Plan (2010 SOP) a
- Page 169 and 170:
5Note 13. Subsequent eventsSince th
- Page 171 and 172:
Commercial reserves and contingent
- Page 173 and 174:
Area TullowLicenceFieldssq km inter
- Page 175 and 176:
Licence / BlocksFieldsAreasq kmTull
- Page 177 and 178:
ContactsSecretary & registered offi
- Page 179 and 180:
KKenya 6, 7, 57Key financial metric
- Page 181 and 182:
MmmbblmmboemmscfdMoUMTMMillion barr
- Page 183 and 184:
This report is printed on Heaven 42