Tullow Oil plc Annual Report 2011 - The Group
Tullow Oil plc Annual Report 2011 - The Group
Tullow Oil plc Annual Report 2011 - The Group
- No tags were found...

You also want an ePaper? Increase the reach of your titles
YUMPU automatically turns print PDFs into web optimized ePapers that Google loves.
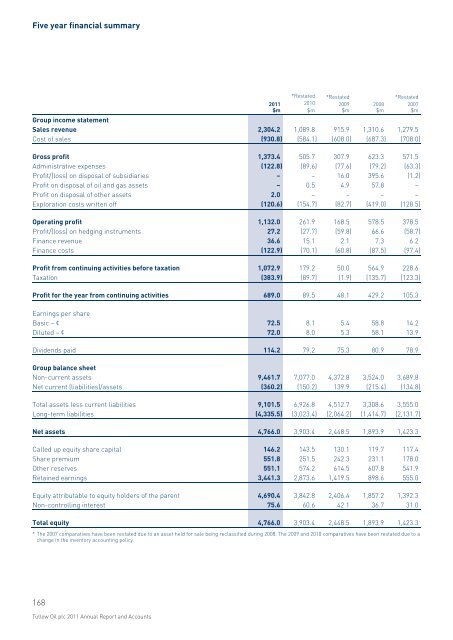
Five year financial summary<strong>2011</strong>$m*Restated2010$m*Restated2009$m2008$m*Restated2007$m<strong>Group</strong> income statementSales revenue 2,304.2 1,089.8 915.9 1,310.6 1,279.5Cost of sales (930.8) (584.1) (608.0) (687.3) (708.0)Gross profit 1,373.4 505.7 307.9 623.3 571.5Administrative expenses (122.8) (89.6) (77.6) (79.2) (63.3)Profit/(loss) on disposal of subsidiaries – – 16.0 395.6 (1.2)Profit on disposal of oil and gas assets – 0.5 4.9 57.8 –Profit on disposal of other assets 2.0 – – – –Exploration costs written off (120.6) (154.7) (82.7) (419.0) (128.5)Operating profit 1,132.0 261.9 168.5 578.5 378.5Profit/(loss) on hedging instruments 27.2 (27.7) (59.8) 66.6 (58.7)Finance revenue 36.6 15.1 2.1 7.3 6.2Finance costs (122.9) (70.1) (60.8) (87.5) (97.4)Profit from continuing activities before taxation 1,072.9 179.2 50.0 564.9 228.6Taxation (383.9) (89.7) (1.9) (135.7) (123.3)Profit for the year from continuing activities 689.0 89.5 48.1 429.2 105.3Earnings per shareBasic – ¢ 72.5 8.1 5.4 58.8 14.2Diluted – ¢ 72.0 8.0 5.3 58.1 13.9Dividends paid 114.2 79.2 75.3 80.9 78.9<strong>Group</strong> balance sheetNon-current assets 9,461.7 7,077.0 4,372.8 3,524.0 3,689.8Net current (liabilities)/assets (360.2) (150.2) 139.9 (215.4) (134.8)Total assets less current liabilities 9,101.5 6,926.8 4,512.7 3,308.6 3,555.0Long-term liabilities (4,335.5) (3,023.4) (2,064.2) (1,414.7) (2,131.7)Net assets 4,766.0 3,903.4 2,448.5 1,893.9 1,423.3Called up equity share capital 146.2 143.5 130.1 119.7 117.4Share premium 551.8 251.5 242.3 231.1 178.0Other reserves 551.1 574.2 614.5 607.8 541.9Retained earnings 3,441.3 2,873.6 1,419.5 898.6 555.0Equity attributable to equity holders of the parent 4,690.4 3,842.8 2,406.4 1,857.2 1,392.3Non-controlling interest 75.6 60.6 42.1 36.7 31.0Total equity 4,766.0 3,903.4 2,448.5 1,893.9 1,423.3* <strong>The</strong> 2007 comparatives have been restated due to an asset held for sale being reclassified during 2008. <strong>The</strong> 2009 and 2010 comparatives have been restated due to achange in the inventory accounting policy.168<strong>Tullow</strong> <strong>Oil</strong> <strong>plc</strong> <strong>2011</strong> <strong>Annual</strong> <strong>Report</strong> and Accounts