(SAR) to Support Agricultural Monitoring 2 - Group on Earth ...
(SAR) to Support Agricultural Monitoring 2 - Group on Earth ...
(SAR) to Support Agricultural Monitoring 2 - Group on Earth ...

Create successful ePaper yourself
Turn your PDF publications into a flip-book with our unique Google optimized e-Paper software.
Internati<strong>on</strong>al GEO Workshop <strong>on</strong> <str<strong>on</strong>g>SAR</str<strong>on</strong>g> <str<strong>on</strong>g>to</str<strong>on</strong>g> <str<strong>on</strong>g>Support</str<strong>on</strong>g> <str<strong>on</strong>g>Agricultural</str<strong>on</strong>g> M<strong>on</strong>i<str<strong>on</strong>g>to</str<strong>on</strong>g>ring<br />
3. The Resp<strong>on</strong>dents<br />
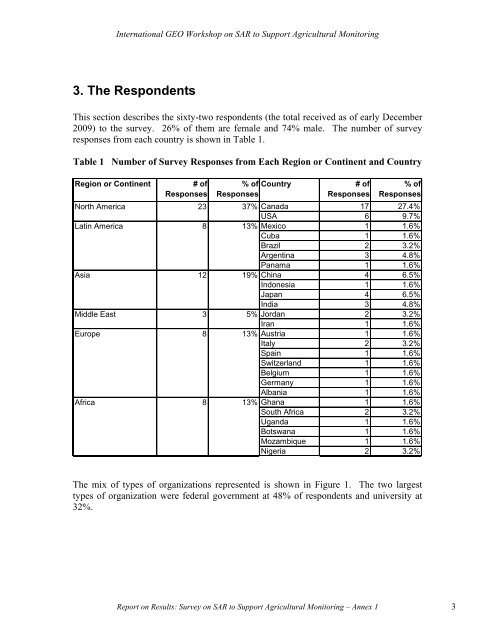
This secti<strong>on</strong> describes the sixty-two resp<strong>on</strong>dents (the <str<strong>on</strong>g>to</str<strong>on</strong>g>tal received as of early December<br />
2009) <str<strong>on</strong>g>to</str<strong>on</strong>g> the survey. 26% of them are female and 74% male. The number of survey<br />
resp<strong>on</strong>ses from each country is shown in Table 1.<br />
Table 1 Number of Survey Resp<strong>on</strong>ses from Each Regi<strong>on</strong> or C<strong>on</strong>tinent and Country<br />
Regi<strong>on</strong> or C<strong>on</strong>tinent # of<br />
Resp<strong>on</strong>ses<br />
North America 23 37%<br />
Latin America 8 13%<br />
Asia<br />
Middle East<br />
Europe<br />
Africa<br />
12<br />
3<br />
8<br />
8<br />
% of Country # of<br />
Resp<strong>on</strong>ses<br />
Resp<strong>on</strong>ses<br />
19%<br />
5%<br />
13%<br />
13%<br />
% of<br />
Resp<strong>on</strong>ses<br />
Canada 17 27.4%<br />
USA 6 9.7%<br />
Mexico 1 1.6%<br />
Cuba 1 1.6%<br />
Brazil 2 3.2%<br />
Argentina 3 4.8%<br />
Panama 1 1.6%<br />
China 4 6.5%<br />
Ind<strong>on</strong>esia 1 1.6%<br />
Japan 4 6.5%<br />
India 3 4.8%<br />
Jordan 2 3.2%<br />
Iran 1 1.6%<br />
Austria 1 1.6%<br />
Italy 2 3.2%<br />
Spain 1 1.6%<br />
Switzerland 1 1.6%<br />
Belgium 1 1.6%<br />
Germany 1 1.6%<br />
Albania 1 1.6%<br />
Ghana 1 1.6%<br />
South Africa 2 3.2%<br />
Uganda 1 1.6%<br />
Botswana 1 1.6%<br />
Mozambique 1 1.6%<br />
Nigeria 2 3.2%<br />
The mix of types of organizati<strong>on</strong>s represented is shown in Figure 1. The two largest<br />
types of organizati<strong>on</strong> were federal government at 48% of resp<strong>on</strong>dents and university at<br />
32%.<br />
Report <strong>on</strong> Results: Survey <strong>on</strong> <str<strong>on</strong>g>SAR</str<strong>on</strong>g> <str<strong>on</strong>g>to</str<strong>on</strong>g> <str<strong>on</strong>g>Support</str<strong>on</strong>g> <str<strong>on</strong>g>Agricultural</str<strong>on</strong>g> M<strong>on</strong>i<str<strong>on</strong>g>to</str<strong>on</strong>g>ring – Annex 1 3