ASReml-S reference manual - VSN International
ASReml-S reference manual - VSN International
ASReml-S reference manual - VSN International
- No tags were found...
You also want an ePaper? Increase the reach of your titles
YUMPU automatically turns print PDFs into web optimized ePapers that Google loves.
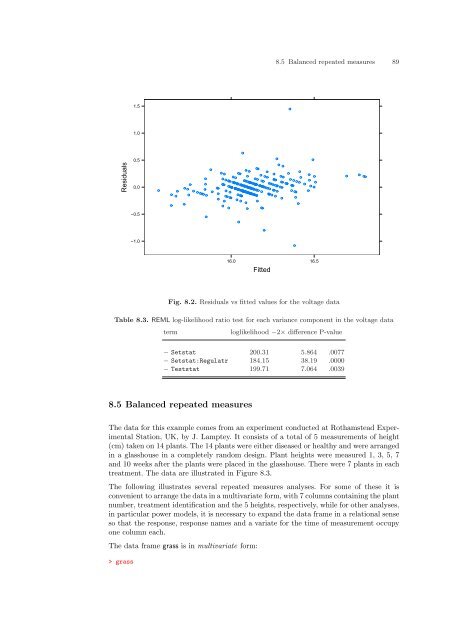
8.5 Balanced repeated measures 891.51.0Residuals0.50.0−0.5−1.016.0 16.5FittedFig. 8.2. Residuals vs fitted values for the voltage dataTable 8.3. REML log-likelihood ratio test for each variance component in the voltage datatermloglikelihood −2× difference P-value− Setstat 200.31 5.864 .0077− Setstat:Regulatr 184.15 38.19 .0000− Teststat 199.71 7.064 .00398.5 Balanced repeated measuresThe data for this example comes from an experiment conducted at Rothamstead ExperimentalStation, UK, by J. Lamptey. It consists of a total of 5 measurements of height(cm) taken on 14 plants. The 14 plants were either diseased or healthy and were arrangedin a glasshouse in a completely random design. Plant heights were measured 1, 3, 5, 7and 10 weeks after the plants were placed in the glasshouse. There were 7 plants in eachtreatment. The data are illustrated in Figure 8.3.The following illustrates several repeated measures analyses. For some of these it isconvenient to arrange the data in a multivariate form, with 7 columns containing the plantnumber, treatment identification and the 5 heights, respectively, while for other analyses,in particular power models, it is necessary to expand the data frame in a relational senseso that the response, response names and a variate for the time of measurement occupyone column each.The data frame grass is in multivariate form:> grass


