

ASReml-S reference manual - VSN International
ASReml-S reference manual - VSN International
ASReml-S reference manual - VSN International
- No tags were found...

You also want an ePaper? Increase the reach of your titles
YUMPU automatically turns print PDFs into web optimized ePapers that Google loves.
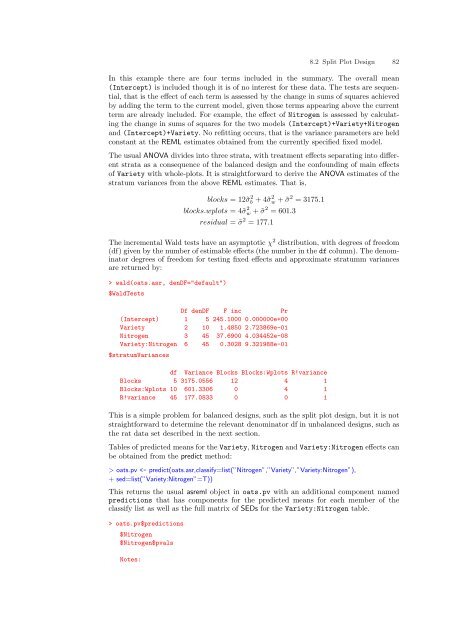
8.2 Split Plot Design 82In this example there are four terms included in the summary. The overall mean(Intercept) is included though it is of no interest for these data. The tests are sequential,that is the effect of each term is assessed by the change in sums of squares achievedby adding the term to the current model, given those terms appearing above the currentterm are already included. For example, the effect of Nitrogen is assessed by calculatingthe change in sums of squares for the two models (Intercept)+Variety+Nitrogenand (Intercept)+Variety. No refitting occurs, that is the variance parameters are heldconstant at the REML estimates obtained from the currently specified fixed model.The usual ANOVA divides into three strata, with treatment effects separating into differentstrata as a consequence of the balanced design and the confounding of main effectsof Variety with whole-plots. It is straightforward to derive the ANOVA estimates of thestratum variances from the above REML estimates. That is,blocks = 12˜σ 2 b + 4˜σ 2 w + ˜σ 2 = 3175.1blocks.wplots = 4˜σ 2 w + ˜σ 2 = 601.3residual = ˜σ 2 = 177.1The incremental Wald tests have an asymptotic χ 2 distribution, with degrees of freedom(df) given by the number of estimable effects (the number in the df column). The denominatordegrees of freedom for testing fixed effects and approximate stratumm variancesare returned by:> wald(oats.asr, denDF="default")$WaldTestsDf denDF F inc Pr(Intercept) 1 5 245.1000 0.000000e+00Variety 2 10 1.4850 2.723869e-01Nitrogen 3 45 37.6900 4.034452e-08Variety:Nitrogen 6 45 0.3028 9.321988e-01$stratumVariancesdf Variance Blocks Blocks:Wplots R!varianceBlocks 5 3175.0556 12 4 1Blocks:Wplots 10 601.3306 0 4 1R!variance 45 177.0833 0 0 1This is a simple problem for balanced designs, such as the split plot design, but it is notstraightforward to determine the relevant denominator df in unbalanced designs, such asthe rat data set described in the next section.Tables of predicted means for the Variety, Nitrogen and Variety:Nitrogen effects canbe obtained from the predict method:> oats.pv oats.pv$predictions$Nitrogen$Nitrogen$pvalsNotes:


