

ASReml-S reference manual - VSN International
ASReml-S reference manual - VSN International
ASReml-S reference manual - VSN International
- No tags were found...

Create successful ePaper yourself
Turn your PDF publications into a flip-book with our unique Google optimized e-Paper software.
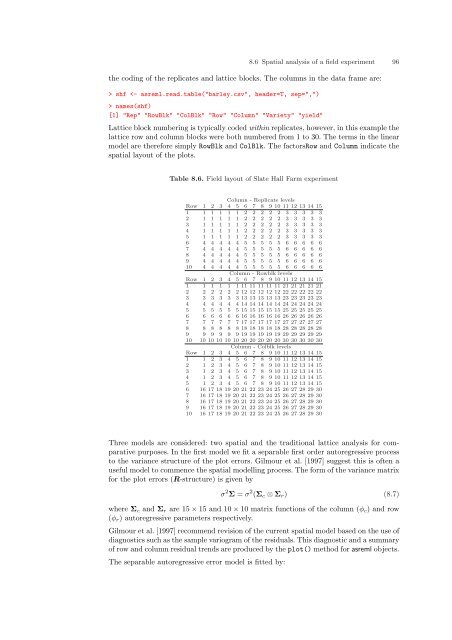
8.6 Spatial analysis of a field experiment 96the coding of the replicates and lattice blocks. The columns in the data frame are:> shf names(shf)[1] "Rep" "RowBlk" "ColBlk" "Row" "Column" "Variety" "yield"Lattice block numbering is typically coded within replicates, however, in this example thelattice row and column blocks were both numbered from 1 to 30. The terms in the linearmodel are therefore simply RowBlk and ColBlk. The factorsRow and Column indicate thespatial layout of the plots.Table 8.6. Field layout of Slate Hall Farm experimentColumn - Replicate levelsRow 1 2 3 4 5 6 7 8 9 10 11 12 13 14 151 1 1 1 1 1 2 2 2 2 2 3 3 3 3 32 1 1 1 1 1 2 2 2 2 2 3 3 3 3 33 1 1 1 1 1 2 2 2 2 2 3 3 3 3 34 1 1 1 1 1 2 2 2 2 2 3 3 3 3 35 1 1 1 1 1 2 2 2 2 2 3 3 3 3 36 4 4 4 4 4 5 5 5 5 5 6 6 6 6 67 4 4 4 4 4 5 5 5 5 5 6 6 6 6 68 4 4 4 4 4 5 5 5 5 5 6 6 6 6 69 4 4 4 4 4 5 5 5 5 5 6 6 6 6 610 4 4 4 4 4 5 5 5 5 5 6 6 6 6 6Column - Rowblk levelsRow 1 2 3 4 5 6 7 8 9 10 11 12 13 14 151 1 1 1 1 1 11 11 11 11 11 21 21 21 21 212 2 2 2 2 2 12 12 12 12 12 22 22 22 22 223 3 3 3 3 3 13 13 13 13 13 23 23 23 23 234 4 4 4 4 4 14 14 14 14 14 24 24 24 24 245 5 5 5 5 5 15 15 15 15 15 25 25 25 25 256 6 6 6 6 6 16 16 16 16 16 26 26 26 26 267 7 7 7 7 7 17 17 17 17 17 27 27 27 27 278 8 8 8 8 8 18 18 18 18 18 28 28 28 28 289 9 9 9 9 9 19 19 19 19 19 29 29 29 29 2910 10 10 10 10 10 20 20 20 20 20 30 30 30 30 30Column - Colblk levelsRow 1 2 3 4 5 6 7 8 9 10 11 12 13 14 151 1 2 3 4 5 6 7 8 9 10 11 12 13 14 152 1 2 3 4 5 6 7 8 9 10 11 12 13 14 153 1 2 3 4 5 6 7 8 9 10 11 12 13 14 154 1 2 3 4 5 6 7 8 9 10 11 12 13 14 155 1 2 3 4 5 6 7 8 9 10 11 12 13 14 156 16 17 18 19 20 21 22 23 24 25 26 27 28 29 307 16 17 18 19 20 21 22 23 24 25 26 27 28 29 308 16 17 18 19 20 21 22 23 24 25 26 27 28 29 309 16 17 18 19 20 21 22 23 24 25 26 27 28 29 3010 16 17 18 19 20 21 22 23 24 25 26 27 28 29 30Three models are considered: two spatial and the traditional lattice analysis for comparativepurposes. In the first model we fit a separable first order autoregressive processto the variance structure of the plot errors. Gilmour et al. [1997] suggest this is often auseful model to commence the spatial modelling process. The form of the variance matrixfor the plot errors (R-structure) is given byσ 2 Σ = σ 2 (Σ c ⊗ Σ r ) (8.7)where Σ c and Σ r are 15 × 15 and 10 × 10 matrix functions of the column (φ c ) and row(φ r ) autoregressive parameters respectively.Gilmour et al. [1997] recommend revision of the current spatial model based on the use ofdiagnostics such as the sample variogram of the residuals. This diagnostic and a summaryof row and column residual trends are produced by the plot() method for asreml objects.The separable autoregressive error model is fitted by:


