

ASReml-S reference manual - VSN International
ASReml-S reference manual - VSN International
ASReml-S reference manual - VSN International
- No tags were found...

Create successful ePaper yourself
Turn your PDF publications into a flip-book with our unique Google optimized e-Paper software.
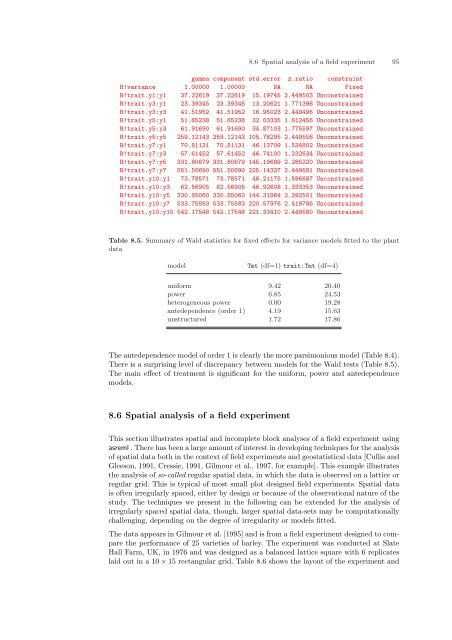
8.6 Spatial analysis of a field experiment 95gamma component std.error z.ratio constraintR!variance 1.00000 1.00000 NA NA FixedR!trait.y1:y1 37.22619 37.22619 15.19745 2.449503 UnconstrainedR!trait.y3:y1 23.39345 23.39345 13.20621 1.771398 UnconstrainedR!trait.y3:y3 41.51952 41.51952 16.95023 2.449496 UnconstrainedR!trait.y5:y1 51.65238 51.65238 32.03335 1.612456 UnconstrainedR!trait.y5:y3 61.91690 61.91690 34.87103 1.775597 UnconstrainedR!trait.y5:y5 259.12143 259.12143 105.78295 2.449558 UnconstrainedR!trait.y7:y1 70.81131 70.81131 46.13709 1.534802 UnconstrainedR!trait.y7:y3 57.61452 57.61452 46.74100 1.232634 UnconstrainedR!trait.y7:y5 331.80679 331.80679 145.19689 2.285220 UnconstrainedR!trait.y7:y7 551.50690 551.50690 225.14337 2.449581 UnconstrainedR!trait.y10:y1 73.78571 73.78571 46.21175 1.596687 UnconstrainedR!trait.y10:y3 62.56905 62.56905 46.92608 1.333353 UnconstrainedR!trait.y10:y5 330.85060 330.85060 144.31864 2.292501 UnconstrainedR!trait.y10:y7 533.75583 533.75583 220.57976 2.419786 UnconstrainedR!trait.y10:y10 542.17548 542.17548 221.33410 2.449580 UnconstrainedTable 8.5. Summary of Wald statistics for fixed effects for variance models fitted to the plantdatamodelTmt (df=1) trait:Tmt (df=4)uniform 9.42 20.40power 6.85 24.53heterogeneous power 0.00 19.28antedependence (order 1) 4.19 15.63unstructured 1.72 17.86The antedependence model of order 1 is clearly the more parsimonious model (Table 8.4).There is a surprising level of discrepancy between models for the Wald tests (Table 8.5).The main effect of treatment is significant for the uniform, power and antedependencemodels.8.6 Spatial analysis of a field experimentThis section illustrates spatial and incomplete block analyses of a field experiment usingasreml . There has been a large amount of interest in developing techniques for the analysisof spatial data both in the context of field experiments and geostatistical data [Cullis andGleeson, 1991, Cressie, 1991, Gilmour et al., 1997, for example]. This example illustratesthe analysis of so-called regular spatial data, in which the data is observed on a lattice orregular grid. This is typical of most small plot designed field experiments. Spatial datais often irregularly spaced, either by design or because of the observational nature of thestudy. The techniques we present in the following can be extended for the analysis ofirregularly spaced spatial data, though, larger spatial data-sets may be computationallychallenging, depending on the degree of irregularity or models fitted.The data appears in Gilmour et al. [1995] and is from a field experiment designed to comparethe performance of 25 varieties of barley. The experiment was conducted at SlateHall Farm, UK, in 1976 and was designed as a balanced lattice square with 6 replicateslaid out in a 10 × 15 rectangular grid. Table 8.6 shows the layout of the experiment and


