

ASReml-S reference manual - VSN International
ASReml-S reference manual - VSN International
ASReml-S reference manual - VSN International
- No tags were found...

Create successful ePaper yourself
Turn your PDF publications into a flip-book with our unique Google optimized e-Paper software.
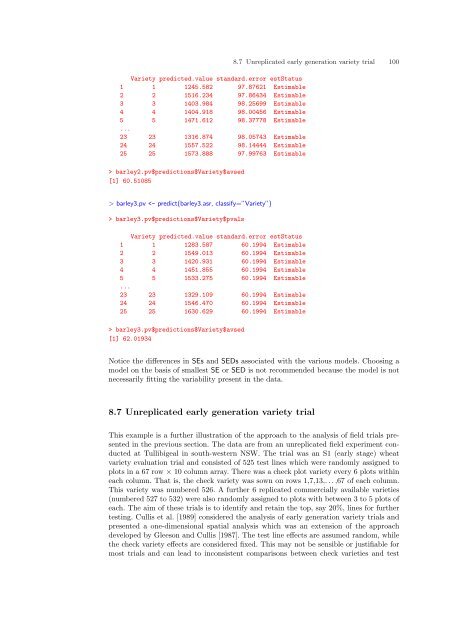
Variety predicted.value standard.error estStatus1 1 1245.582 97.87621 Estimable2 2 1516.234 97.86434 Estimable3 3 1403.984 98.25699 Estimable4 4 1404.918 98.00456 Estimable5 5 1471.612 98.37778 Estimable...23 23 1316.874 98.05743 Estimable24 24 1557.522 98.14444 Estimable25 25 1573.888 97.99763 Estimable> barley2.pv$predictions$Variety$avsed[1] 60.510858.7 Unreplicated early generation variety trial 100> barley3.pv barley3.pv$predictions$Variety$pvalsVariety predicted.value standard.error estStatus1 1 1283.587 60.1994 Estimable2 2 1549.013 60.1994 Estimable3 3 1420.931 60.1994 Estimable4 4 1451.855 60.1994 Estimable5 5 1533.275 60.1994 Estimable...23 23 1329.109 60.1994 Estimable24 24 1546.470 60.1994 Estimable25 25 1630.629 60.1994 Estimable> barley3.pv$predictions$Variety$avsed[1] 62.01934Notice the differences in SEs and SEDs associated with the various models. Choosing amodel on the basis of smallest SE or SED is not recommended because the model is notnecessarily fitting the variability present in the data.8.7 Unreplicated early generation variety trialThis example is a further illustration of the approach to the analysis of field trials presentedin the previous section. The data are from an unreplicated field experiment conductedat Tullibigeal in south-western NSW. The trial was an S1 (early stage) wheatvariety evaluation trial and consisted of 525 test lines which were randomly assigned toplots in a 67 row × 10 column array. There was a check plot variety every 6 plots withineach column. That is, the check variety was sown on rows 1,7,13,. . . ,67 of each column.This variety was numbered 526. A further 6 replicated commercially available varieties(numbered 527 to 532) were also randomly assigned to plots with between 3 to 5 plots ofeach. The aim of these trials is to identify and retain the top, say 20%, lines for furthertesting. Cullis et al. [1989] considered the analysis of early generation variety trials andpresented a one-dimensional spatial analysis which was an extension of the approachdeveloped by Gleeson and Cullis [1987]. The test line effects are assumed random, whilethe check variety effects are considered fixed. This may not be sensible or justifiable formost trials and can lead to inconsistent comparisons between check varieties and test


