ASReml-S reference manual - VSN International
ASReml-S reference manual - VSN International
ASReml-S reference manual - VSN International
- No tags were found...
You also want an ePaper? Increase the reach of your titles
YUMPU automatically turns print PDFs into web optimized ePapers that Google loves.
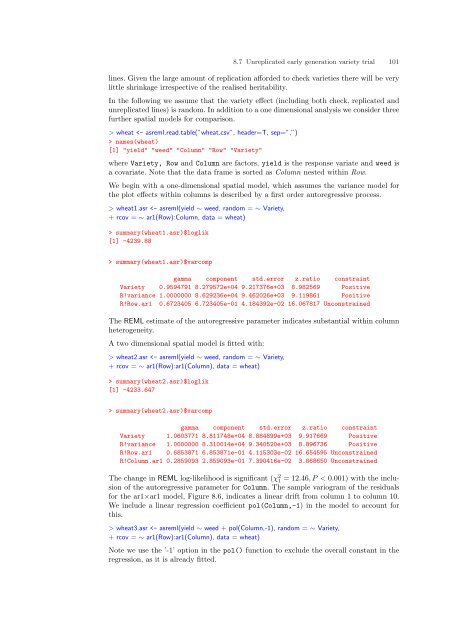
8.7 Unreplicated early generation variety trial 101lines. Given the large amount of replication afforded to check varieties there will be verylittle shrinkage irrespective of the realised heritability.In the following we assume that the variety effect (including both check, replicated andunreplicated lines) is random. In addition to a one dimensional analysis we consider threefurther spatial models for comparison.> wheat names(wheat)[1] "yield" "weed" "Column" "Row" "Variety"where Variety, Row and Column are factors, yield is the response variate and weed isa covariate. Note that the data frame is sorted as Column nested within Row.We begin with a one-dimensional spatial model, which assumes the variance model forthe plot effects within columns is described by a first order autoregressive process.> wheat1.asr summary(wheat1.asr)$loglik[1] -4239.88> summary(wheat1.asr)$varcompgamma component std.error z.ratio constraintVariety 0.9594791 8.279572e+04 9.217376e+03 8.982569 PositiveR!variance 1.0000000 8.629236e+04 9.462026e+03 9.119861 PositiveR!Row.ar1 0.6723405 6.723405e-01 4.184392e-02 16.067817 UnconstrainedThe REML estimate of the autoregressive parameter indicates substantial within columnheterogeneity.A two dimensional spatial model is fitted with:> wheat2.asr summary(wheat2.asr)$loglik[1] -4233.647> summary(wheat2.asr)$varcompgamma component std.error z.ratio constraintVariety 1.0603771 8.811748e+04 8.884899e+03 9.917669 PositiveR!variance 1.0000000 8.310014e+04 9.340520e+03 8.896736 PositiveR!Row.ar1 0.6853871 6.853871e-01 4.115303e-02 16.654595 UnconstrainedR!Column.ar1 0.2859093 2.859093e-01 7.390416e-02 3.868650 UnconstrainedThe change in REML log-likelihood is significant (χ 2 1 = 12.46, P < 0.001) with the inclusionof the autoregressive parameter for Column. The sample variogram of the residualsfor the ar1×ar1 model, Figure 8.6, indicates a linear drift from column 1 to column 10.We include a linear regression coefficient pol(Column,-1) in the model to account forthis.> wheat3.asr


