

ASReml-S reference manual - VSN International
ASReml-S reference manual - VSN International
ASReml-S reference manual - VSN International
- No tags were found...

You also want an ePaper? Increase the reach of your titles
YUMPU automatically turns print PDFs into web optimized ePapers that Google loves.
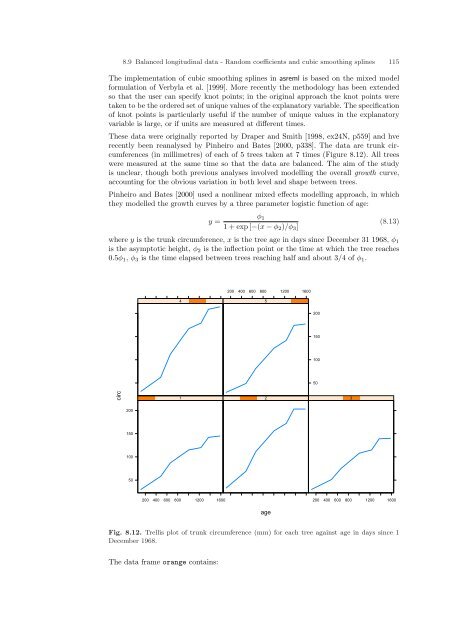
8.9 Balanced longitudinal data - Random coefficients and cubic smoothing splines 115The implementation of cubic smoothing splines in asreml is based on the mixed modelformulation of Verbyla et al. [1999]. More recently the methodology has been extendedso that the user can specify knot points; in the original approach the knot points weretaken to be the ordered set of unique values of the explanatory variable. The specificationof knot points is particularly useful if the number of unique values in the explanatoryvariable is large, or if units are measured at different times.These data were originally reported by Draper and Smith [1998, ex24N, p559] and hverecently been reanalysed by Pinheiro and Bates [2000, p338]. The data are trunk circumferences(in millimetres) of each of 5 trees taken at 7 times (Figure 8.12). All treeswere measured at the same time so that the data are balanced. The aim of the studyis unclear, though both previous analyses involved modelling the overall growth curve,accounting for the obvious variation in both level and shape between trees.Pinheiro and Bates [2000] used a nonlinear mixed effects modelling approach, in whichthey modelled the growth curves by a three parameter logistic function of age:y =φ 11 + exp [−(x − φ 2 )/φ 3 ](8.13)where y is the trunk circumference, x is the tree age in days since December 31 1968, φ 1is the asymptotic height, φ 2 is the inflection point or the time at which the tree reaches0.5φ 1 , φ 3 is the time elapsed between trees reaching half and about 3/4 of φ 1 .200 400 600 800 1200 16004520015010050circ1 2320015010050200 400 600 800 1200 1600200 400 600 800 1200 1600ageFig. 8.12. Trellis plot of trunk circumference (mm) for each tree against age in days since 1December 1968.The data frame orange contains:


