8.3 Unbalanced nested design 84[4,] 7.682954 7.682954 7.682954 NA 9.715025 9.715025 9.715025 9.715025[5,] 9.715025 9.715025 9.715025 9.715025 NA 7.682954 7.682954 7.682954[6,] 9.715025 9.715025 9.715025 9.715025 7.682954 NA 7.682954 7.682954[7,] 9.715025 9.715025 9.715025 9.715025 7.682954 7.682954 NA 7.682954[8,] 9.715025 9.715025 9.715025 9.715025 7.682954 7.682954 7.682954 NA[9,] 9.715025 9.715025 9.715025 9.715025 9.715025 9.715025 9.715025 9.715025[10,] 9.715025 9.715025 9.715025 9.715025 9.715025 9.715025 9.715025 9.715025[11,] 9.715025 9.715025 9.715025 9.715025 9.715025 9.715025 9.715025 9.715025[12,] 9.715025 9.715025 9.715025 9.715025 9.715025 9.715025 9.715025 9.715025[,9] [,10] [,11] [,12][1,] 9.715025 9.715025 9.715025 9.715025[2,] 9.715025 9.715025 9.715025 9.715025[3,] 9.715025 9.715025 9.715025 9.715025[4,] 9.715025 9.715025 9.715025 9.715025[5,] 9.715025 9.715025 9.715025 9.715025[6,] 9.715025 9.715025 9.715025 9.715025[7,] 9.715025 9.715025 9.715025 9.715025[8,] 9.715025 9.715025 9.715025 9.715025[9,] NA 7.682954 7.682954 7.682954[10,] 7.682954 NA 7.682954 7.682954[11,] 7.682954 7.682954 NA 7.682954[12,] 7.682954 7.682954 7.682954 NA$‘Variety:Nitrogen‘$avsedmin mean max7.682954 9.160824 9.715025For the first two predictions, the average SED is calculated from the average variance ofdifferences.8.3 Unbalanced nested designThis example illustrates some further aspects of testing fixed effects in linear mixedmodels. It differs from the previous split plot example in that it is unbalanced, so morecare is required in assessing the significance of fixed effects.The experiment was reported by Dempster et al. [1984] and was designed to comparethe effect of three doses of an experimental compound (control, low and high) on thematernal performance of rats. Thirty female rats (Dams) were randomly split into threegroups of 10 and each group randomly assigned to the three different doses. All pups ineach litter were weighed. The litters differed both in total size and composition of malesand females. Thus the additional covariate littersize was included in the analysis. Thedifferential effect of the compound on male and female pups was also of interest.Three litters had to be dropped from the experiment, which meant that one dose had only7 dams. The analysis must account for the presence of between dam variation, but mustalso recognise the stratification of the experimental units (pups within litters) and therestricted randomisation of the doses to the dams. An indicative ANOVA decompositionfor this experiment is given in Table 8.2.The Dose and littersize effects are implicitly tested against the residual dam variation,while the remaining effects are tested against the residual within litter variation. Theasreml call is:> rats.asr
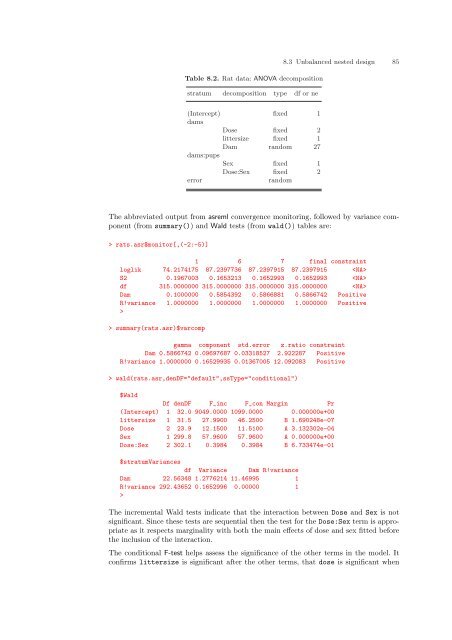
Table 8.2. Rat data: ANOVA decompositionstratum decomposition type df or ne8.3 Unbalanced nested design 85(Intercept) fixed 1damsDose fixed 2littersize fixed 1Dam random 27dams:pupsSex fixed 1Dose:Sex fixed 2errorrandomThe abbreviated output from asreml convergence monitoring, followed by variance component(from summary()) and Wald tests (from wald()) tables are:> rats.asr$monitor[,(-2:-5)]1 6 7 final constraintloglik 74.2174175 87.2397736 87.2397915 87.2397915 S2 0.1967003 0.1653213 0.1652993 0.1652993 df 315.0000000 315.0000000 315.0000000 315.0000000 Dam 0.1000000 0.5854392 0.5866881 0.5866742 PositiveR!variance 1.0000000 1.0000000 1.0000000 1.0000000 Positive>> summary(rats.asr)$varcompgamma component std.error z.ratio constraintDam 0.5866742 0.09697687 0.03318527 2.922287 PositiveR!variance 1.0000000 0.16529935 0.01367005 12.092083 Positive> wald(rats.asr,denDF="default",ssType="conditional")$WaldDf denDF F_inc F_con Margin Pr(Intercept) 1 32.0 9049.0000 1099.0000 0.000000e+00littersize 1 31.5 27.9900 46.2500 B 1.690248e-07Dose 2 23.9 12.1500 11.5100 A 3.132302e-04Sex 1 299.8 57.9600 57.9600 A 0.000000e+00Dose:Sex 2 302.1 0.3984 0.3984 B 6.733474e-01$stratumVariancesdf Variance Dam R!varianceDam 22.56348 1.2776214 11.46995 1R!variance 292.43652 0.1652996 0.00000 1>The incremental Wald tests indicate that the interaction between Dose and Sex is notsignificant. Since these tests are sequential then the test for the Dose:Sex term is appropriateas it respects marginality with both the main effects of dose and sex fitted beforethe inclusion of the interaction.The conditional F-test helps assess the significance of the other terms in the model. Itconfirms littersize is significant after the other terms, that dose is significant when