

ASReml-S reference manual - VSN International
ASReml-S reference manual - VSN International
ASReml-S reference manual - VSN International
- No tags were found...

You also want an ePaper? Increase the reach of your titles
YUMPU automatically turns print PDFs into web optimized ePapers that Google loves.
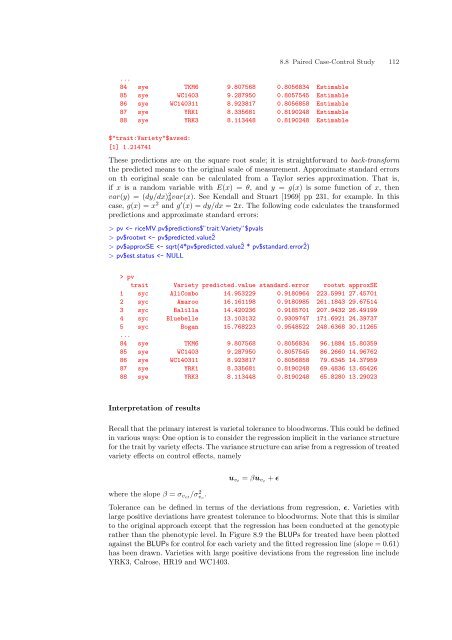
8.8 Paired Case-Control Study 112...84 sye TKM6 9.807568 0.8056834 Estimable85 sye WC1403 9.287950 0.8057545 Estimable86 sye WC140311 8.923817 0.8056858 Estimable87 sye YRK1 8.335681 0.8190248 Estimable88 sye YRK3 8.113448 0.8190248 Estimable$"trait:Variety"$avsed:[1] 1.214741These predictions are on the square root scale; it is straightforward to back-transformthe predicted means to the original scale of measurement. Approximate standard errorson th eoriginal scale can be calculated from a Taylor series approximation. That is,if x is a random variable with E(x) = θ, and y = g(x) is some function of x, thenvar(y) = (dy/dx) 2 θvar(x). See Kendall and Stuart [1969] pp 231, for example. In thiscase, g(x) = x 2 and g ′ (x) = dy/dx = 2x. The following code calculates the transformedpredictions and approximate standard errors:> pv pv$rootwt pv$approxSE pv$est.status pvtrait Variety predicted.value standard.error rootwt approxSE1 syc AliCombo 14.953229 0.9180964 223.5991 27.457012 syc Amaroo 16.161198 0.9180985 261.1843 29.675143 syc Balilla 14.420236 0.9185701 207.9432 26.491994 syc Bluebelle 13.103132 0.9309747 171.6921 24.397375 syc Bogan 15.768223 0.9548522 248.6368 30.11265...84 sye TKM6 9.807568 0.8056834 96.1884 15.8035985 sye WC1403 9.287950 0.8057545 86.2660 14.9676286 sye WC140311 8.923817 0.8056858 79.6345 14.3795987 sye YRK1 8.335681 0.8190248 69.4836 13.6542688 sye YRK3 8.113448 0.8190248 65.8280 13.29023Interpretation of resultsRecall that the primary interest is varietal tolerance to bloodworms. This could be definedin various ways: One option is to consider the regression implicit in the variance structurefor the trait by variety effects. The variance structure can arise from a regression of treatedvariety effects on control effects, namelywhere the slope β = σ vct /σ 2 v c.u vt= βu vc + ɛTolerance can be defined in terms of the deviations from regression, ɛ. Varieties withlarge positive deviations have greatest tolerance to bloodworms. Note that this is similarto the original approach except that the regression has been conducted at the genotypicrather than the phenotypic level. In Figure 8.9 the BLUPs for treated have been plottedagainst the BLUPs for control for each variety and the fitted regression line (slope = 0.61)has been drawn. Varieties with large positive deviations from the regression line includeYRK3, Calrose, HR19 and WC1403.


