

ASReml-S reference manual - VSN International
ASReml-S reference manual - VSN International
ASReml-S reference manual - VSN International
- No tags were found...

Create successful ePaper yourself
Turn your PDF publications into a flip-book with our unique Google optimized e-Paper software.
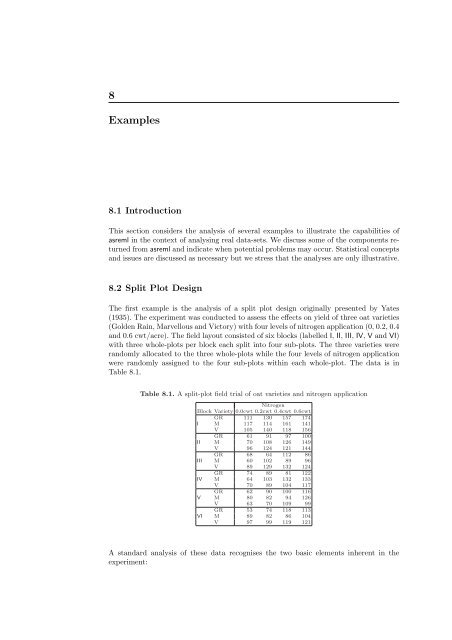
8Examples8.1 IntroductionThis section considers the analysis of several examples to illustrate the capabilities ofasreml in the context of analysing real data-sets. We discuss some of the components returnedfrom asreml and indicate when potential problems may occur. Statistical conceptsand issues are discussed as necessary but we stress that the analyses are only illustrative.8.2 Split Plot DesignThe first example is the analysis of a split plot design originally presented by Yates(1935). The experiment was conducted to assess the effects on yield of three oat varieties(Golden Rain, Marvellous and Victory) with four levels of nitrogen application (0, 0.2, 0.4and 0.6 cwt/acre). The field layout consisted of six blocks (labelled I, II, III, IV, V and VI)with three whole-plots per block each split into four sub-plots. The three varieties wererandomly allocated to the three whole-plots while the four levels of nitrogen applicationwere randomly assigned to the four sub-plots within each whole-plot. The data is inTable 8.1.Table 8.1. A split-plot field trial of oat varieties and nitrogen applicationNitrogenBlock Variety 0.0cwt 0.2cwt 0.4cwt 0.6cwtGR 111 130 157 174I M 117 114 161 141V 105 140 118 156GR 61 91 97 100II M 70 108 126 149V 96 124 121 144GR 68 64 112 86III M 60 102 89 96V 89 129 132 124GR 74 89 81 122IV M 64 103 132 133V 70 89 104 117GR 62 90 100 116V M 80 82 94 126V 63 70 109 99GR 53 74 118 113VI M 89 82 86 104V 97 99 119 121A standard analysis of these data recognises the two basic elements inherent in theexperiment:


