ASReml-S reference manual - VSN International
ASReml-S reference manual - VSN International
ASReml-S reference manual - VSN International
- No tags were found...
Create successful ePaper yourself
Turn your PDF publications into a flip-book with our unique Google optimized e-Paper software.
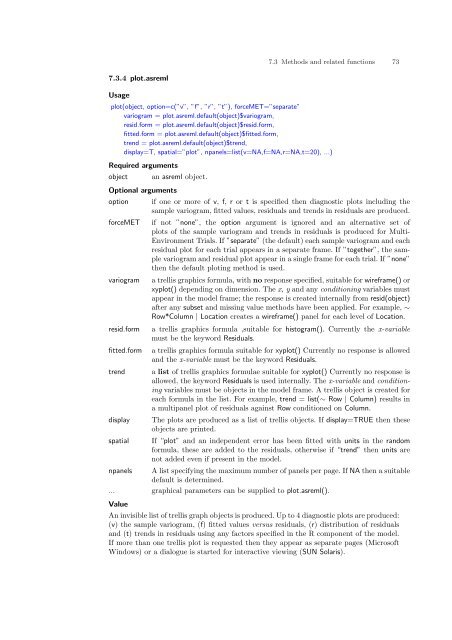
7.3 Methods and related functions 737.3.4 plot.asremlUsageplot(object, option=c(”v”, ”f”, ”r”, ”t”), forceMET=”separate”variogram = plot.asreml.default(object)$variogram,resid.form = plot.asreml.default(object)$resid.form,fitted.form = plot.asreml.default(object)$fitted.form,trend = plot.asreml.default(object)$trend,display=T, spatial=”plot”, npanels=list(v=NA,f=NA,r=NA,t=20), ...)Required argumentsobjectOptional argumentsoptionforceMETvariogramresid.formfitted.formtrenddisplayspatialan asreml object.if one or more of v, f, r or t is specified then diagnostic plots including thesample variogram, fitted values, residuals and trends in residuals are produced.if not ”none”, the option argument is ignored and an alternative set ofplots of the sample variogram and trends in residuals is produced for Multi-Environment Trials. If ”separate” (the default) each sample variogram and eachresidual plot for each trial appears in a separate frame. If ”together”, the samplevariogram and residual plot appear in a single frame for each trial. If ”none”then the default ploting method is used.a trellis graphics formula, with no response specified, suitable for wireframe() orxyplot() depending on dimension. The x, y and any conditioning variables mustappear in the model frame; the response is created internally from resid(object)after any subset and missing value methods have been applied. For example, ∼Row*Column | Location creates a wireframe() panel for each level of Location.a trellis graphics formula ,suitable for histogram(). Currently the x-variablemust be the keyword Residuals.a trellis graphics formula suitable for xyplot() Currently no response is allowedand the x-variable must be the keyword Residuals.a list of trellis graphics formulae suitable for xyplot() Currently no response isallowed, the keyword Residuals is used internally. The x-variable and conditioningvariables must be objects in the model frame. A trellis object is created foreach formula in the list. For example, trend = list(∼ Row | Column) results ina multipanel plot of residuals against Row conditioned on Column.The plots are produced as a list of trellis objects. If display=TRUE then theseobjects are printed.If “plot” and an independent error has been fitted with units in the randomformula, these are added to the residuals, otherwise if “trend” then units arenot added even if present in the model.npanels A list specifying the maximum number of panels per page. If NA then a suitabledefault is determined.... graphical parameters can be supplied to plot.asreml().ValueAn invisible list of trellis graph objects is produced. Up to 4 diagnostic plots are produced:(v) the sample variogram, (f) fitted values versus residuals, (r) distribution of residualsand (t) trends in residuals using any factors specified in the R component of the model.If more than one trellis plot is requested then they appear as separate pages (MicrosoftWindows) or a dialogue is started for interactive viewing (SUN Solaris).


