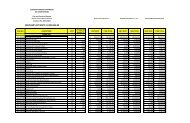
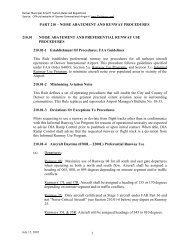
The Westin Denver International Airport<strong>Hotel</strong> <strong>Market</strong> <strong>Analysis</strong>Presented in the following table is the projected performance of the competitivemarket for the period 2012 to 2019. We have provided the 2011 performance of thecompetitive market as a basis of comparison.The Westin Denver International AirportCompetitive <strong>Market</strong>Estimated Future Growth in Lodging Supply <strong>and</strong> <strong>Dem<strong>and</strong></strong>2012 - 20192011 2012 2013 2014 2015 2016 2017 2018 2019ROOMS SUPPLY 5,339Additions/(Deletions) to SupplyThe Westin Denver International Airport 216 303Four Seasons Dow ntow n Denver (239 rms 10/2010) 179Embassy Suites Dow ntow n Denver (403 rms 12/2010) 403Renaissance <strong>Hotel</strong> (231 rms 1/2014) 231Cumulative Rooms Supply 5,921 5,921 5,921 6,152 6,368 6,671 6,671 6,671 6,671--------- --------- --------- --------- --------- --------- --------- --------- ---------Total Annual Rooms Supply 2,161,165 2,161,165 2,161,165 2,245,480 2,324,320 2,434,915 2,434,915 2,434,915 2,434,915Grow th Over the Prior Year 10.9% 0.0% 0.0% 3.9% 3.5% 4.8% 0.0% 0.0% 0.0%DEMONSTRATED DEMAND IN BASE YRTransient 769,358 50%Group 683,649 45%Contract/Crew 82,186 5%--------- ---------TOTAL DEMONSTRATED DEMAND 1,535,193 100%--------- ---------PROJECTED DEMANDTransientDemonstrated 769,358 784,745 800,440 816,449 855,218 887,622 925,775 944,290 963,176Induced/(Unsatisfied) 0 0 (18,991) (18,824) (26,855) (16,983) (54,420) (72,144) (90,254)--------- --------- --------- --------- --------- --------- --------- --------- ---------Total 769,400 784,700 781,400 797,600 828,400 870,600 871,400 872,100 872,900Grow th Over Prior Year N/A 2.0% -0.4% 2.1% 3.9% 5.1% 0.1% 0.1% 0.1%--------- --------- --------- --------- --------- --------- --------- --------- ---------GroupDemonstrated 683,649 697,322 711,268 725,494 747,144 772,286 803,032 819,093 835,475Induced/(Unsatisfied) 0 0 (16,875) (29,276) (26,566) (17,178) (47,205) (62,579) (78,287)--------- --------- --------- --------- --------- --------- --------- --------- ---------Total 683,600 697,300 694,400 696,200 720,600 755,100 755,800 756,500 757,200Grow th Over Prior Year N/A 2.0% -0.4% 0.3% 3.5% 4.8% 0.1% 0.1% 0.1%--------- --------- --------- --------- --------- --------- --------- --------- ---------Contract/CrewDemonstrated 82,186 82,186 82,186 82,186 82,186 82,186 82,186 82,186 82,186Induced/(Unsatisfied) 0 0 (1,989) (4,192) (4,103) (3,493) (4,928) (6,405) (7,855)--------- --------- --------- --------- --------- --------- --------- --------- ---------Total 82,200 82,200 80,200 78,000 78,100 78,700 77,300 75,800 74,300Grow th Over Prior Year N/A 0.0% -2.4% -2.7% 0.1% 0.8% -1.8% -1.9% -2.0%--------- --------- --------- --------- --------- --------- --------- --------- ---------Total <strong>Market</strong> <strong>Dem<strong>and</strong></strong> 1,535,200 1,564,200 1,556,000 1,571,800 1,627,100 1,704,400 1,704,500 1,704,400 1,704,400Grow th Over Prior Year N/A 1.9% -0.5% 1.0% 3.5% 4.8% 0.0% 0.0% 0.0%<strong>Market</strong> Occupancy 71% 72% 72% 70% 70% 70% 70% 70% 70%Source: <strong>PKF</strong> Consulting USAAs noted, we project accommodated dem<strong>and</strong> to increase 1.9 percent in 2012,resulting in a market occupancy level of 72 percent. This estimate is slightly lowerthan the performance of the competitive market through YTD June 2012.Accommodated dem<strong>and</strong> is projected to remain relatively unchanged in 2013resulting in continued occupancy at 72 percent. Beginning in 2014, we project thecompetitive market to achieve a stabilized occupancy level of 70 percent. Whileaccommodated dem<strong>and</strong> is projected to increase in 2014, as a result of the openingof the 231-room Renaissance hotel, <strong>and</strong> in 2015 <strong>and</strong> 2016 as a result of theaddition of the 519-room proposed Subject, market occupancy is projected toIV-33
The Westin Denver International Airport<strong>Hotel</strong> <strong>Market</strong> <strong>Analysis</strong>remain at 70 percent due to the increase in annual supply. This stabilizedoccupancy level is in line with the average annual occupancy level of thecompetitive market achieved over the past five years. It should be noted that whilethe identified competitive market occupancy may exceed or fall below 70 percent inany specific year, our projection of a stabilized occupancy of 70 percent representsthe most likely level of performance of the market over our 10-year projectionperiod.F. IN-TERMINAL LODGING MARKET OVERVIEWIn our review of the proposed Subject as an in-terminal hotel, we have alsoperformed an analysis of other in-terminal hotels located at the major airportsthroughout the U.S. <strong>and</strong> Canada. <strong>Hotel</strong>s that are physically attached to a majorU.S. airport, classified as “in-terminal” hotels, are relatively rare in the United States,but we have identified all of these hotels throughout the U.S. <strong>and</strong> Canada. Thesehotels represent nationally affiliated, luxury <strong>and</strong> upper upscale chain hotels, many ofwhich are more than 20 years old. Presented in the table on the following page is asummary of in-terminal hotels, which include ten hotels in the U.S. <strong>and</strong> two inCanada. Also included in this table is the year-end 2011 total passenger volume foreach of the hotels. As noted, there are a total of 5,319 guestrooms amongst these12 in-terminal hotels.IV-34