PKF Hotel Market Demand and Financial Analysis - DIA Business ...
PKF Hotel Market Demand and Financial Analysis - DIA Business ...
PKF Hotel Market Demand and Financial Analysis - DIA Business ...

You also want an ePaper? Increase the reach of your titles
YUMPU automatically turns print PDFs into web optimized ePapers that Google loves.
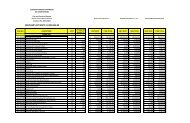
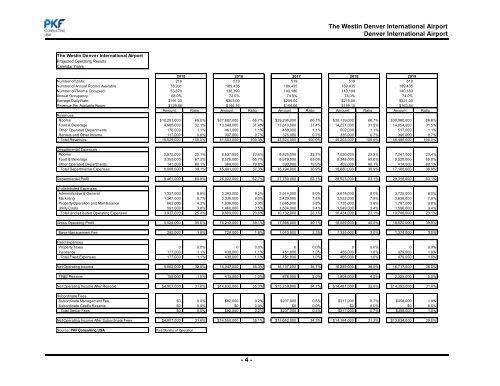
The Westin Denver International AirportDenver International AirportThe Westin Denver International AirportProjected Operating ResultsCalendar Years2015 2016 2017 2018 2019Number of Units: 216 519 519 519 519Number of Annual Rooms Available: 78,931 189,435 189,435 189,435 189,435Number of Rooms Occupied: 53,670 136,390 140,180 140,180 140,180Annual Occupancy: 68.0% 72.0% 74.0% 74.0% 74.0%Average Daily Rate: $191.00 $203.00 $209.00 $215.00 $221.00Revenue Per Available Room: $129.88 $146.16 $154.66 $159.10 $163.54Amount Ratio Amount Ratio Amount Ratio Amount Ratio Amount RatioRevenuesRooms $10,251,000 66.0% $27,687,000 66.7% $29,298,000 66.7% $30,139,000 66.7% $30,980,000 66.6%Food & Beverage 4,985,000 32.1% 13,048,000 31.4% 13,813,000 31.4% 14,227,000 31.5% 14,654,000 31.5%Other Operated Departments 176,000 1.1% 461,000 1.1% 488,000 1.1% 502,000 1.1% 517,000 1.1%Rentals <strong>and</strong> Other Income 117,000 0.8% 307,000 0.7% 325,000 0.7% 335,000 0.7% 345,000 0.7%Total Revenues 15,529,000 100.0% 41,503,000 100.0% 43,924,000 100.0% 45,203,000 100.0% 46,496,000 100.0%Departmental ExpensesRooms 2,572,000 25.1% 6,537,000 23.6% 6,825,000 23.3% 7,030,000 23.3% 7,241,000 23.4%Food & Beverage 3,355,000 67.3% 8,576,000 65.7% 8,979,000 65.0% 9,248,000 65.0% 9,525,000 65.0%Other Operated Departments 141,000 80.1% 368,000 79.8% 390,000 79.9% 402,000 80.1% 414,000 80.1%Total Departmental Expenses 6,068,000 39.1% 15,481,000 37.3% 16,194,000 36.9% 16,680,000 36.9% 17,180,000 36.9%Departmental Profit 9,461,000 60.9% 26,022,000 62.7% 27,730,000 63.1% 28,523,000 63.1% 29,316,000 63.1%Undistributed ExpensesAdministrative & General 1,337,000 8.6% 3,383,000 8.2% 3,514,000 8.0% 3,618,000 8.0% 3,725,000 8.0%<strong>Market</strong>ing 1,347,000 8.7% 3,330,000 8.0% 3,429,000 7.8% 3,532,000 7.8% 3,638,000 7.8%Property Operation <strong>and</strong> Maintenance 662,000 4.3% 1,636,000 3.9% 1,685,000 3.8% 1,735,000 3.8% 1,787,000 3.8%Utility Costs 591,000 3.8% 1,460,000 3.5% 1,504,000 3.4% 1,549,000 3.4% 1,596,000 3.4%Total Undistributed Operating Expenses 3,937,000 25.4% 9,809,000 23.6% 10,132,000 23.1% 10,434,000 23.1% 10,746,000 23.1%Gross Operating Profit 5,524,000 35.6% 16,213,000 39.1% 17,598,000 40.1% 18,089,000 40.0% 18,570,000 39.9%Base Management Fee 285,000 1.8% 728,000 1.8% 1,010,000 2.3% 1,335,000 3.0% 1,374,000 3.0%Fixed ExpensesProperty Taxes 0 0.0% 0 0.0% 0 0.0% 0 0.0% 0 0.0%Insurance 177,000 1.1% 438,000 1.1% 451,000 1.0% 465,000 1.0% 479,000 1.0%Total Fixed Expenses 177,000 1.1% 438,000 1.1% 451,000 1.0% 465,000 1.0% 479,000 1.0%Net Operating Income 5,062,000 32.6% 15,047,000 36.3% 16,137,000 36.7% 16,289,000 36.0% 16,717,000 36.0%FF&E Reserve 155,000 1.0% 415,000 1.0% 878,000 2.0% 1,808,000 4.0% 2,325,000 5.0%Net Operating Income After Reserve $4,907,000 31.6% $14,632,000 35.3% $15,259,000 34.7% $14,481,000 32.0% $14,392,000 31.0%Subordinate FeesSubordinate Management Fee $0 0.0% $82,000 0.2% $207,000 0.5% $317,000 0.7% $458,000 1.0%Subordinate CapEx Reserve $0 0.0% $0 0.0% $0 0.0% $0 0.0% $0 0.0%Total Senior Fees $0 0.0% $82,000 0.2% $207,000 0.5% $317,000 0.7% $458,000 1.0%Net Operating Income After Subordinate Fees $4,907,000 31.6% $14,550,000 35.1% $15,052,000 34.3% $14,164,000 31.3% $13,934,000 30.0%Source: <strong>PKF</strong> Consulting USA Five Months of Operation- 4 -